PNC Bank 2006 Annual Report Download - page 129
Download and view the complete annual report
Please find page 129 of the 2006 PNC Bank annual report below. You can navigate through the pages in the report by either clicking on the pages listed below, or by using the keyword search tool below to find specific information within the annual report.-
 1
1 -
2
-
3
-
4
-
5
-
6
-
7
-
8
-
9
-
10
-
11
-
12
-
13
-
14
-
15
-
16
-
17
-
18
-
19
-
20
-
21
-
22
-
23
-
24
-
25
-
26
-
27
-
28
-
29
-
30
-
31
-
32
-
33
-
34
-
35
-
36
-
37
-
38
-
39
-
40
-
41
-
42
-
43
-
44
-
45
-
46
-
47
-
48
-
49
-
50
-
51
-
52
-
53
-
54
-
55
-
56
-
57
-
58
-
59
-
60
-
61
-
62
-
63
-
64
-
65
-
66
-
67
-
68
-
69
-
70
-
71
-
72
-
73
-
74
-
75
-
76
-
77
-
78
-
79
-
80
-
81
-
82
-
83
-
84
-
85
-
86
-
87
-
88
-
89
-
90
-
91
-
92
-
93
-
94
-
95
-
96
-
97
-
98
-
99
-
100
-
101
-
102
-
103
-
104
-
105
-
106
-
107
-
108
-
109
-
110
-
111
-
112
-
113
-
114
-
115
-
116
-
117
-
118
-
 119
119 -
 120
120 -
 121
121 -
 122
122 -
 123
123 -
 124
124 -
 125
125 -
 126
126 -
 127
127 -
 128
128 -
 129
129 -
 130
130 -
 131
131 -
 132
132 -
 133
133 -
 134
134 -
 135
135 -
 136
136 -
 137
137 -
 138
138 -
 139
139 -
140
-
141
-
142
-
143
-
144
-
145
-
146
-
147
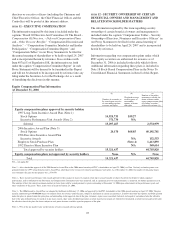
 |
 |

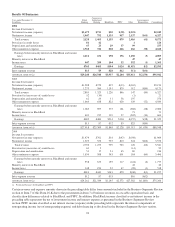
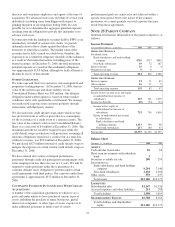
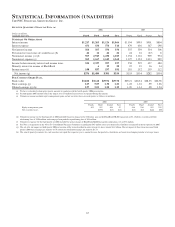
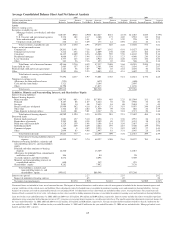
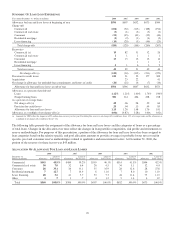
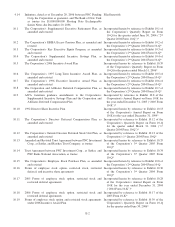
Average Consolidated Balance Sheet And Net Interest Analysis
2006 2005 2004
Taxable-equivalent basis
Dollars in millions
Average
Balances
Interest
Income/Expense
Average
Yields/Rates
Average
Balances
Interest
Income/Expense
Average
Yields/Rates
Average
Balances
Interest
Income/Expense
Average
Yields/Rates
Assets
Interest-earning assets
Securities available for sale
Mortgage-backed, asset-backed, and other
debt $18,587 $926 4.98% $14,627 $631 4.31% $11,483 $435 3.79%
U.S. Treasury and government agencies 2,334 102 4.37 4,308 173 4.02 3,943 112 2.84
State and municipal 148 8 5.41 167 9 5.39 220 16 7.27
Corporate stocks and other 246 14 5.69 173 12 6.94 232 10 4.31
Total securities available for sale 21,315 1,050 4.93 19,275 825 4.28 15,878 573 3.61
Loans, net of unearned income
Commercial 20,201 1,451 7.18 19,007 1,142 6.01 16,627 838 5.04
Commercial real estate 3,212 232 7.22 2,609 158 6.06 2,137 102 4.77
Consumer 16,125 1,009 6.26 16,208 905 5.58 14,165 728 5.14
Residential mortgage 6,888 375 5.44 6,136 321 5.23 4,040 210 5.20
Lease financing 2,777 123 4.43 2,944 132 4.48 3,470 156 4.50
Other 363 26 7.16 453 22 4.86 506 16 3.16
Total loans, net of unearned income 49,566 3,216 6.49 47,357 2,680 5.66 40,945 2,050 5.01
Loans held for sale 2,683 157 5.85 2,301 104 4.52 1,636 47 2.87
Federal funds sold and resale agreements 1,143 58 5.07 985 25 2.54 1,670 30 1.80
Other 2,985 156 5.23 3,083 133 4.31 1,692 72 4.26
Total interest-earning assets/interest
income 77,692 4,637 5.97 73,001 3,767 5.16 61,821 2,772 4.48
Noninterest-earning assets
Allowance for loan and lease losses (591) (632) (608)
Cash and due from banks 3,121 3,164 2,895
Other 14,790 13,015 11,158
Total assets $95,012 $88,548 $75,266
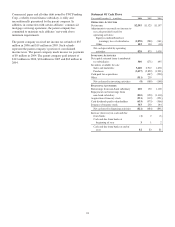
Liabilities, Minority and Noncontrolling Interests, and Shareholders’ Equity
Interest-bearing liabilities
Interest-bearing deposits
Money market $19,745 663 3.36 $17,930 403 2.25 $15,964 151 .95
Demand 8,187 88 1.07 8,224 56 .68 7,902 32 .40
Savings 2,081 10 .48 2,645 16 .60 2,684 11 .41
Retail certificates of deposit 13,999 582 4.16 11,623 371 3.19 9,075 244 2.69
Other time 1,364 66 4.84 1,559 59 3.78 686 26 3.79
Time deposits in foreign offices 3,613 181 5.01 2,347 76 3.24 1,371 20 1.46
Total interest-bearing deposits 48,989 1,590 3.25 44,328 981 2.21 37,682 484 1.28
Borrowed funds
Federal funds purchased 3,081 157 5.10 2,098 71 3.38 1,957 26 1.33
Repurchase agreements 2,205 101 4.58 2,189 65 2.97 1,433 18 1.26
Bank notes and senior debt 3,128 159 5.08 3,198 114 3.56 2,687 61 2.27
Subordinated debt 4,417 269 6.09 4,044 197 4.87 3,506 139 3.96
Commercial paper 166 8 4.82 2,223 71 3.19 1,887 27 1.43
Other 2,046 83 4.06 2,447 81 3.31 1,045 28 2.68
Total borrowed funds 15,043 777 5.17 16,199 599 3.70 12,515 299 2.39
Total interest-bearing liabilities/interest
expense 64,032 2,367 3.70 60,527 1,580 2.61 50,197 783 1.56
Noninterest-bearing liabilities, minority and
noncontrolling interests, and shareholders’
equity
Demand and other noninterest-bearing
deposits 14,320 13,309 12,015
Allowance for unfunded loan commitments
and letters of credit 106 80 90
Accrued expenses and other liabilities 6,672 6,098 5,389
Minority and noncontrolling interests in
consolidated entities 600 542 455
Shareholders’ equity 9,282 7,992 7,120
Total liabilities, minority and
noncontrolling interests, and
shareholders’ equity $95,012 $88,548 $75,266
Interest rate spread 2.27 2.55 2.92
Impact of noninterest-bearing sources .65 .45 .30
Net interest income/margin $2,270 2.92% $2,187 3.00% $1,989 3.22%
Nonaccrual loans are included in loans, net of unearned income. The impact of financial derivatives used in interest rate risk management is included in the interest income/expense and
average yields/rates of the related assets and liabilities. Basis adjustments related to hedged items are included in noninterest-earning assets and noninterest-bearing liabilities. Average
balances of securities are based on amortized historical cost (excluding SFAS 115 adjustments to fair value which are included in other assets). Average balances for certain loans and
borrowed funds accounted for at fair value, with changes in fair value recorded in trading noninterest income, are included in noninterest-earning assets and noninterest-bearing liabilities.
Loan fees for the years ended December 31, 2006, 2005 and 2004 were $35 million, $91 million and $109 million, respectively. Interest income includes the effects of taxable-equivalent
adjustments using a marginal federal income tax rate of 35% to increase tax-exempt interest income to a taxable-equivalent basis. The taxable-equivalent adjustments to interest income for
the years ended December 31, 2006, 2005 and 2004 were $25 million, $33 million and $20 million, respectively. Average securities held to maturity totaled less than $.5 million for the
year ended December 31, 2006, $1 million for the year ended December 31, 2005 and $2 million for the year ended December 31, 2004 and are included in the “Mortgage-backed, asset-
backed, and other debt” category.
119