PNC Bank 2006 Annual Report Download - page 38
Download and view the complete annual report
Please find page 38 of the 2006 PNC Bank annual report below. You can navigate through the pages in the report by either clicking on the pages listed below, or by using the keyword search tool below to find specific information within the annual report.-
 1
1 -
2
-
3
-
4
-
5
-
6
-
7
-
8
-
9
-
10
-
11
-
12
-
13
-
14
-
15
-
16
-
17
-
18
-
19
-
20
-
21
-
22
-
23
-
24
-
25
-
26
-
27
-
 28
28 -
 29
29 -
 30
30 -
 31
31 -
 32
32 -
 33
33 -
 34
34 -
 35
35 -
 36
36 -
 37
37 -
 38
38 -
 39
39 -
 40
40 -
 41
41 -
 42
42 -
 43
43 -
 44
44 -
 45
45 -
 46
46 -
 47
47 -
 48
48 -
49
-
50
-
51
-
52
-
53
-
54
-
55
-
56
-
57
-
58
-
59
-
60
-
61
-
62
-
63
-
64
-
65
-
66
-
67
-
68
-
69
-
70
-
71
-
72
-
73
-
74
-
75
-
76
-
77
-
78
-
79
-
80
-
81
-
82
-
83
-
84
-
85
-
86
-
87
-
88
-
89
-
90
-
91
-
92
-
93
-
94
-
95
-
96
-
97
-
98
-
99
-
100
-
101
-
102
-
103
-
104
-
105
-
106
-
107
-
108
-
109
-
110
-
111
-
112
-
113
-
114
-
115
-
116
-
117
-
118
-
119
-
120
-
121
-
122
-
123
-
124
-
125
-
126
-
127
-
128
-
129
-
130
-
131
-
132
-
133
-
134
-
135
-
136
-
137
-
138
-
139
-
140
-
141
-
142
-
143
-
144
-
145
-
146
-
147
 |
 |

customers if specified future events occur. At December 31,
2006, the largest industry concentration was for general
medical and surgical hospitals, which accounted for
approximately 5% of the total letters of credit and bankers’
acceptances.
Leases and Related Tax and Accounting Matters
The equipment lease portfolio totaled $3.6 billion at
December 31, 2006. Aggregate residual value at risk on the
lease portfolio at December 31, 2006 was $1.1 billion. We
have taken steps to mitigate $.6 billion of this residual risk,
including residual value insurance coverage with third parties,
third party guarantees, and other actions. The portfolio
included approximately $1.7 billion of cross-border leases at
December 31, 2006. Cross-border leases are leveraged leases
of equipment located in foreign countries, primarily in western
Europe and Australia. We have not entered into cross-border
lease transactions since 2003.
Upon completing an examination of our 1998-2000 and 2001-
2003 consolidated federal income tax returns, the IRS
provided us with examination reports which propose increases
in our tax liability, principally arising from adjustments to the
timing of tax deductions from several of our cross-border
lease transactions.
While the situation with respect to these proposed adjustments
remains unresolved, we believe our reserves for these
exposures were appropriate at December 31, 2006.
In July 2006, the Financial Accounting Standards Board
(“FASB”) issued FASB Staff Position No. FAS 13-2,
Accounting for a Change or Projected Change in the Timing
of Cash Flows Relating to Income Taxes Generated by a
Leveraged Lease Transaction (“FSP 13-2”).FSP 13-2 became
effective January 1, 2007 and requires a recalculation of the
timing of income recognition and the reevaluation of lease
classification for actual or projected changes in the timing of
tax benefits for leveraged leases. Any cumulative adjustment
must be recognized through retained earnings upon adoption
of FSP 13-2. See Note 1 Accounting Policies in the Notes To
Consolidated Financial Statements in Item 8 of this Report for
additional information. Effective January 1, 2007, we
recorded a cumulative adjustment to beginning retained
earnings from the recalculations of $149 million, after-tax, as
required by FSP 13-2. This adjustment was based on our best
estimate as to the timing and amount of ultimate settlement of
this exposure. Any immediate or future reductions in earnings
from our adoption of FSP 13-2 would be recovered in
subsequent years.
The US Senate has passed a bill that, if it became law, would
have an adverse impact on the tax treatment for our cross-
border lease transactions. The US House of Representatives has
passed a different version of this legislation that does not
contain any provisions relating to the taxation of cross-border
lease transactions. The differences between the two versions of
this legislation will be resolved in conference. We cannot
predict whether or not any new law impacting the tax treatment
for our cross-border lease transactions will be enacted.
In addition to these transactions, three lease-to-service
contract transactions that we were party to were structured as
partnerships for tax purposes. However, we do not believe that
our exposure from these transactions is material to our
consolidated results of operations or financial position.
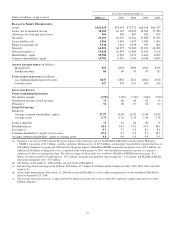
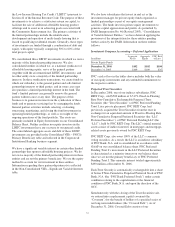
S
ECURITIES
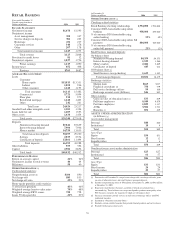
Details Of Securities (a)
Amortized Fair
In millions Cost Value
December 31, 2006
S
ECURITIES
A
VAILABLE FOR
S
ALE
Debt securities
U.S. Treasury and government agencies $611 $608
Mortgage-backed 17,325 17,208
Commercial mortgage-backed 3,231 3,219
Asset-backed 1,615 1,609
State and municipal 140 139
Other debt 90 87
Corporate stocks and other 321 321
Total securities available for sale $23,333 $23,191
December 31, 2005
S
ECURITIES
A
VAILABLE FOR
S
ALE
Debt securities
U.S. Treasury and government agencies $3,816 $3,744
Mortgage-backed 13,794 13,544
Commercial mortgage-backed 1,955 1,919
Asset-backed 1,073 1,063
State and municipal 159 158
Other debt 87 86
Corporate stocks and other 196 196
Total securities available for sale $21,080 $20,710
(a) Securities held to maturity at December 31, 2006 and 2005 were less than
$.5 million.
Securities represented 23% of total assets at both
December 31, 2006 and December 31, 2005. The increase in
total securities compared with December 31, 2005 was
primarily due to higher balances of mortgage-backed and
commercial mortgage-backed securities, which more than
offset the decline in US Treasury and government agencies
securities.
At December 31, 2006, the securities available for sale
balance included a net unrealized loss of $142 million, which
represented the difference between fair value and amortized
cost. The comparable amount at December 31, 2005 was a net
unrealized loss of $370 million. Net unrealized gains and
losses in the securities available for sale portfolio are included
in shareholders’ equity as accumulated other comprehensive
income or loss, net of tax.
The fair value of securities available for sale generally
decreases when interest rates increase and vice versa. Further
increases in interest rates in 2007, if sustained, will adversely
impact the fair value of securities available for sale going
forward compared with the fair value at December 31, 2006.
The expected weighted-average life of securities available for
sale was 3 years and 8 months at December 31, 2006 and 4
years and 1 month at December 31, 2005.
28