PNC Bank 2006 Annual Report Download - page 49
Download and view the complete annual report
Please find page 49 of the 2006 PNC Bank annual report below. You can navigate through the pages in the report by either clicking on the pages listed below, or by using the keyword search tool below to find specific information within the annual report.-
 1
1 -
2
-
3
-
4
-
5
-
6
-
7
-
8
-
9
-
10
-
11
-
12
-
13
-
14
-
15
-
16
-
17
-
18
-
19
-
20
-
21
-
22
-
23
-
24
-
25
-
26
-
27
-
28
-
29
-
30
-
31
-
32
-
33
-
34
-
35
-
36
-
37
-
38
-
 39
39 -
 40
40 -
 41
41 -
 42
42 -
 43
43 -
 44
44 -
 45
45 -
 46
46 -
 47
47 -
 48
48 -
 49
49 -
 50
50 -
 51
51 -
 52
52 -
 53
53 -
 54
54 -
 55
55 -
 56
56 -
 57
57 -
 58
58 -
 59
59 -
60
-
61
-
62
-
63
-
64
-
65
-
66
-
67
-
68
-
69
-
70
-
71
-
72
-
73
-
74
-
75
-
76
-
77
-
78
-
79
-
80
-
81
-
82
-
83
-
84
-
85
-
86
-
87
-
88
-
89
-
90
-
91
-
92
-
93
-
94
-
95
-
96
-
97
-
98
-
99
-
100
-
101
-
102
-
103
-
104
-
105
-
106
-
107
-
108
-
109
-
110
-
111
-
112
-
113
-
114
-
115
-
116
-
117
-
118
-
119
-
120
-
121
-
122
-
123
-
124
-
125
-
126
-
127
-
128
-
129
-
130
-
131
-
132
-
133
-
134
-
135
-
136
-
137
-
138
-
139
-
140
-
141
-
142
-
143
-
144
-
145
-
146
-
147
 |
 |

C
ORPORATE
&I
NSTITUTIONAL
B
ANKING
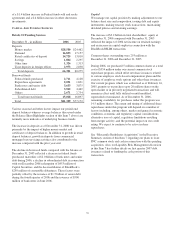
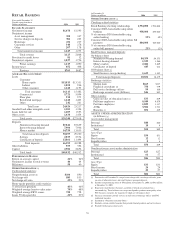
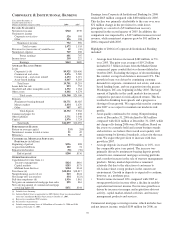
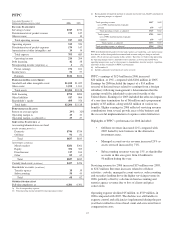
Year ended December 31
Taxable-equivalent basis
Dollars in millions except as noted 2006 2005
I
NCOME
S
TATEMENT
Net interest income $720 $739
Noninterest income
Corporate service fees 526 398
Other 226 198
Noninterest income 752 596
Total revenue 1,472 1,335
Provision for (recoveries of) credit losses 42 (30)
Noninterest expense 749 658
Pretax earnings 681 707
Income taxes 218 227
Earnings $463 $480
A
VERAGE
B
ALANCE
S
HEET
Loans
Corporate (a) (b) $9,925 $10,656
Commercial real estate 2,876 2,289
Commercial – real estate related 2,433 2,071
Asset-based lending 4,467 4,203
Total loans 19,701 19,219
Loans held for sale 893 752
Goodwill and other intangible assets 1,352 1,064
Other assets 4,602 4,274
Total assets $26,548 $25,309
Deposits
Noninterest-bearing demand $6,771 $6,025
Money market 2,654 2,670
Other 907 687
Total deposits 10,332 9,382
Commercial paper (b) 1,838
Other liabilities 3,771 3,348
Capital 1,976 1,724
Total funds $16,079 $16,292
P
ERFORMANCE
R
ATIOS
Return on average capital 23% 28%
Noninterest income to total revenue 51 45
Efficiency 51 49
C
OMMERCIAL
M
ORTGAGE
S
ERVICING
P
ORTFOLIO
(in billions)
Beginning of period $136 $98
Acquisitions/additions 102 74
Repayments/transfers (38) (36)
End of period $200 $136
O
THER
I
NFORMATION
Consolidated revenue from (c):
Treasury management $424 $410
Capital markets $283 $175
Midland Loan Services $184 $144
Total loans (d) $20,054 $18,817
Nonperforming assets (d) (e) $63 $124
Net charge-offs (recoveries) $54 $(23)
Full-time employees (d) 1,936 1,861
Net gains on commercial mortgage loan sales $55 $61
Net carrying amount of commercial mortgage
servicing rights (d) $471 $344
(a) Includes lease financing.
(b) Includes Market Street as applicable for 2005. Market Street was deconsolidated
from our Consolidated Balance Sheet effective October 17, 2005.
(c) Represents consolidated PNC amounts.
(d) Presented as of period end.
(e) Includes nonperforming loans of $50 million at December 31, 2006 and $108
million at December 31, 2005.
Earnings from Corporate & Institutional Banking for 2006
totaled $463 million compared with $480 million for 2005.
This decline was primarily attributable to the year over year
$72 million change in the provision for credit losses
principally as a result of a $53 million loan recovery
recognized in the second quarter of 2005. In addition, the
comparison was impacted by a $137 million increase in total
revenue, while noninterest expenses grew by $91 million in
2006 compared with 2005.
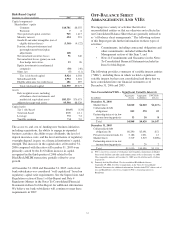
Highlights of 2006 for Corporate & Institutional Banking
included:
• Average loan balances increased $482 million, or 3%,
over 2005. The prior year average of $19.2 billion
included $1.7 billion in loans from the Market Street
commercial paper conduit that was deconsolidated in
October 2005. Excluding the impact of deconsolidating
the conduit, average loan balances increased 12%. The
growth in loans was driven by continuing customer
demand for corporate, commercial real estate, and asset-
based lending loans, and our expansion into the greater
Washington, DC area beginning in May 2005. The large
amount of liquidity in the credit markets has increased
competitive pressures for risk-adjusted returns. This has
resulted in shrinking loan spreads and a progressive
slowing of loan growth. We expect this trend to continue
into 2007 as we expect to maintain our moderate risk
profile.
• Asset quality continued to be strong. Nonperforming
assets at December 31, 2006 declined to $63 million
compared with $124 million at December 31, 2005, while
net charge-offs during 2006 were $54 million. Based on
the assets we currently hold and current business trends
and activities, we believe that overall asset quality will
remain strong by historical standards, at least for the near
term. We expect the provision to increase with loan
growth in 2007.
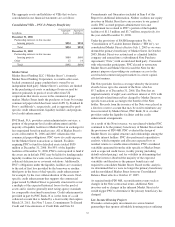
• Average deposits increased $950 million, or 10%, over
the comparable prior year period. The increase was
primarily driven by noninterest-bearing deposit growth
related to our commercial mortgage servicing portfolio
and a modest increase in the sale of treasury management
products. Money market deposits have remained
relatively flat due to the attraction of customers to
off-balance sheet sweep products in the current rate
environment. Growth in deposits is expected to continue,
however, at a moderate pace.
• Total revenue increased 10% compared with 2005 as
strong growth in fee income offset a decline in taxable-
equivalent net interest income. Fee income growth was
driven by increases in merger and acquisition advisory
activity, capital market-related activities, and treasury
management products and services.
Commercial mortgage servicing revenue, which includes fees
and net interest income, totaled $184 million for 2006, an
39