PNC Bank 2006 Annual Report Download - page 31
Download and view the complete annual report
Please find page 31 of the 2006 PNC Bank annual report below. You can navigate through the pages in the report by either clicking on the pages listed below, or by using the keyword search tool below to find specific information within the annual report.-
 1
1 -
2
-
3
-
4
-
5
-
6
-
7
-
8
-
9
-
10
-
11
-
12
-
13
-
14
-
15
-
16
-
17
-
18
-
19
-
20
-
 21
21 -
 22
22 -
 23
23 -
 24
24 -
 25
25 -
 26
26 -
 27
27 -
 28
28 -
 29
29 -
 30
30 -
 31
31 -
 32
32 -
 33
33 -
 34
34 -
 35
35 -
 36
36 -
 37
37 -
 38
38 -
 39
39 -
 40
40 -
 41
41 -
42
-
43
-
44
-
45
-
46
-
47
-
48
-
49
-
50
-
51
-
52
-
53
-
54
-
55
-
56
-
57
-
58
-
59
-
60
-
61
-
62
-
63
-
64
-
65
-
66
-
67
-
68
-
69
-
70
-
71
-
72
-
73
-
74
-
75
-
76
-
77
-
78
-
79
-
80
-
81
-
82
-
83
-
84
-
85
-
86
-
87
-
88
-
89
-
90
-
91
-
92
-
93
-
94
-
95
-
96
-
97
-
98
-
99
-
100
-
101
-
102
-
103
-
104
-
105
-
106
-
107
-
108
-
109
-
110
-
111
-
112
-
113
-
114
-
115
-
116
-
117
-
118
-
119
-
120
-
121
-
122
-
123
-
124
-
125
-
126
-
127
-
128
-
129
-
130
-
131
-
132
-
133
-
134
-
135
-
136
-
137
-
138
-
139
-
140
-
141
-
142
-
143
-
144
-
145
-
146
-
147
 |
 |

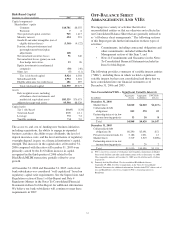
• Loan demand and utilization of credit commitments,
• Movement of customer deposits from lower to higher
rate accounts or to off-balance sheet accounts,
• The level of interest rates, and the shape of the
interest rate yield curve,
• The performance of the capital markets, and
• Customer demand for other products and services.
In addition to changes in general economic conditions,
including the direction, timing and magnitude of movement in
interest rates and the performance of the capital markets, our
success in 2007 will depend, among other things, upon:
• Further success in the acquisition, growth and
retention of customers,
• The successful consummation and integration of the
planned Mercantile acquisition,
• Revenue growth,
• A sustained focus on expense management and
efficiency,
• Maintaining strong overall asset quality, and
• Prudent risk and capital management.
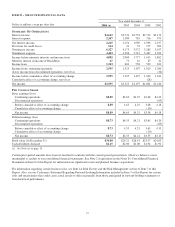
S
UMMARY
F
INANCIAL
R
ESULTS
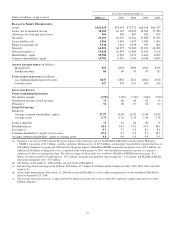
Year ended December 31
In billions, except for
per share data 2006 2005
Net income $2.595 $1.325
Diluted earnings per share $8.73 $4.55
Return on
Average common
shareholders’ equity 27.97% 16.58%
Average assets 2.73% 1.50%
Net income for 2006 included the after-tax impact of the
following items:
• The third quarter gain on the BlackRock/MLIM
transaction of $1.3 billion, or $4.36 per diluted share;
• The third quarter securities portfolio rebalancing loss
of $127 million, or $.43 per diluted share;
• BlackRock/MLIM transaction integration costs of
$47 million, or $.16 per diluted share, and
• The third quarter mortgage loan portfolio
repositioning loss of $31 million, or $.10 per diluted
share.
The aggregate impact of these items increased 2006 net
income by $1.1 billion, or $3.67 per diluted common share.
We refer you to the Consolidated Income Statement Review
portion of the 2005 Versus 2004 section of this Item 7 for
significant items impacting 2005 results.
Our performance in 2006 included the following
accomplishments:
• Our total assets at December 31, 2006 exceeded
$100 billion for the first time, as further detailed in
the Consolidated Balance Sheet Review section of
this Item 7.
• Average total loans of $49.6 billion for 2006
increased $2.2 billion, or 5%, compared with 2005.
Amounts for 2005 included $1.7 billion of average
loans related to the Market Street Funding LLC
(“Market Street”) commercial paper conduit that we
deconsolidated in October 2005, while total 2006
average loans were impacted by the $.5 billion
decline in average residential mortgage loans related
to PNC’s third quarter 2006 balance sheet
repositioning. Apart from the impact of these actions,
the increase was largely due to growth in
commercial, residential mortgage and commercial
real estate loans.
• Average total deposits increased $5.7 billion, or 10%,
compared with the prior year, primarily the result of
an increase in interest-bearing deposits as customers
continued to shift deposits to higher-return accounts
and other products.
• Asset quality remained very strong. Nonperforming
loans totaled $147 million at December 31, 2006, a
decline of $43 million, or 23%, compared with the
balance at December 31, 2005.
B
ALANCE
S
HEET
H
IGHLIGHTS
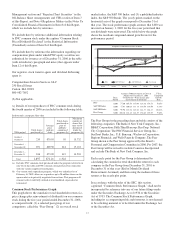
Total average assets were $95.0 billion for 2006 compared
with $88.5 billion for 2005. Average interest-earning assets
were $77.7 billion for 2006 compared with $73.0 billion in
2005, an increase of $4.7 billion or 6%. Increases of
$2.2 billion in average loans and $2.0 billion in average
securities were the primary factors for the increase in average
interest-earning assets.
Average total loans were $49.6 billion in 2006 and
$47.4 billion for 2005. This increase was driven by continued
improvements in market loan demand and targeted sales
efforts across our banking businesses, as well as the full year
impact of our expansion into the greater Washington, D.C.
area, which began in May 2005. The increase in average total
loans reflected growth in commercial loans of $1.2 billion,
residential mortgages of $.8 billion and commercial real estate
loans of $.6 billion, partially offset by modest declines in
consumer and lease financing loans. In addition, average total
loans for 2005 included $1.7 billion related to Market Street
for the period prior to our deconsolidation of that entity in
October 2005. Loans represented 64% of average interest-
earning assets for 2006 and 65% for 2005.
Average securities totaled $21.3 billion in 2006 and
$19.3 billion for 2005. The overall higher average securities
balances reflected our desire to continue investing through the
interest rate cycle and the full year impact of our May 2005
Riggs acquisition. The $2.0 billion increase over 2005
reflected an increase of $4.0 billion in mortgage-backed,
asset-backed and other debt securities, partially offset by a
$2.0 billion decline in US Treasury and government agencies
21