PNC Bank 2006 Annual Report Download - page 35
Download and view the complete annual report
Please find page 35 of the 2006 PNC Bank annual report below. You can navigate through the pages in the report by either clicking on the pages listed below, or by using the keyword search tool below to find specific information within the annual report.-
 1
1 -
2
-
3
-
4
-
5
-
6
-
7
-
8
-
9
-
10
-
11
-
12
-
13
-
14
-
15
-
16
-
17
-
18
-
19
-
20
-
21
-
22
-
23
-
24
-
 25
25 -
 26
26 -
 27
27 -
 28
28 -
 29
29 -
 30
30 -
 31
31 -
 32
32 -
 33
33 -
 34
34 -
 35
35 -
 36
36 -
 37
37 -
 38
38 -
 39
39 -
 40
40 -
 41
41 -
 42
42 -
 43
43 -
 44
44 -
 45
45 -
46
-
47
-
48
-
49
-
50
-
51
-
52
-
53
-
54
-
55
-
56
-
57
-
58
-
59
-
60
-
61
-
62
-
63
-
64
-
65
-
66
-
67
-
68
-
69
-
70
-
71
-
72
-
73
-
74
-
75
-
76
-
77
-
78
-
79
-
80
-
81
-
82
-
83
-
84
-
85
-
86
-
87
-
88
-
89
-
90
-
91
-
92
-
93
-
94
-
95
-
96
-
97
-
98
-
99
-
100
-
101
-
102
-
103
-
104
-
105
-
106
-
107
-
108
-
109
-
110
-
111
-
112
-
113
-
114
-
115
-
116
-
117
-
118
-
119
-
120
-
121
-
122
-
123
-
124
-
125
-
126
-
127
-
128
-
129
-
130
-
131
-
132
-
133
-
134
-
135
-
136
-
137
-
138
-
139
-
140
-
141
-
142
-
143
-
144
-
145
-
146
-
147
 |
 |
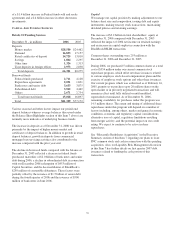
Consumer services fees increased $72 million, to
$365 million, in 2006 compared with 2005. Higher fees
reflected the impact of consolidating our merchant services
activities in the fourth quarter of 2005 as a result of our
increased ownership interest in the merchant services
business. The increase was also due to higher debit card
revenues resulting from higher transaction volumes, our
expansion into the greater Washington, DC area, and pricing
actions related to the One PNC initiative. These factors were
partially offset by lower ATM surcharge revenue in 2006
resulting from changing customer behavior and a strategic
decision to reduce the out-of-footprint ATM network.
Corporate services revenue was $626 million for 2006,
compared with $485 million in 2005. The increase in
corporate services revenue compared with the prior year was
primarily due to the full year benefit in 2006 of our October
2005 acquisition of Harris Williams.
Equity management (private equity) net gains on portfolio
investments totaled $107 million in 2006 and $96 million for
2005. Based on the nature of private equity activities, net
gains or losses may be volatile from period to period.
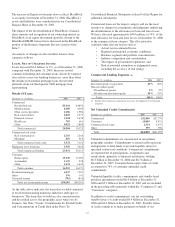
Net securities losses totaled $207 million in 2006 and
$41 million in 2005. Our discussion under the Consolidated
Balance Sheet Review section of this Item 7 provides
additional information regarding actions we took during the
third quarter of 2006 that resulted in the sale of approximately
$6 billion of securities available for sale at an aggregate pretax
loss of $196 million during that quarter.
Noninterest revenue from trading activities, which is primarily
customer-related, totaled $183 million in 2006 compared with
$157 million for 2005. We provide additional information on
our trading activities under Market Risk Management –
Trading Risk in the Risk Management section of this Item 7.
Net gains related to our BlackRock investment were
$2.066 billion for 2006, comprised of the $2.078 billion gain
on the BlackRock/MLIM transaction partially offset by a
fourth quarter mark-to-market adjustment of $12 million on
our BlackRock long-term incentive plan (“LTIP”) obligation.
See the BlackRock portion of the Business Segments Review
section of Item 7 of this Report for further information.
Other noninterest income decreased $57 million, to
$315 million, in 2006 compared with 2005. Other noninterest
income for 2006 included the impact of the following:
• A $48 million pretax loss incurred in the third quarter
of 2006 in connection with the rebalancing of our
residential mortgage portfolio. Further information
on these actions is included in the Loans Held For
Sale portion of the Consolidated Balance Sheet
Review section of this Item 7;
• A $20 million charge for an accounting adjustment
related to our trust preferred securities hedges
recognized during the third quarter of 2006; and
• Lower other equity management income.
These factors were partially offset by higher gains on sales of
education loans held for sale in 2006 compared with the prior
year.
Other noninterest income typically fluctuates from period to
period depending on the nature and magnitude of transactions
completed.
P
RODUCT
R
EVENUE
In addition to credit products to commercial customers,
Corporate & Institutional Banking offers treasury
management and capital markets-related products and
services, commercial loan servicing, and equipment leasing
products that are marketed by several businesses across PNC.
Treasury management revenue, which includes fees as well as
net interest income from customer deposit balances, totaled
$424 million for 2006 and $410 million for 2005. The higher
revenue in 2006 reflected continued expansion and client
utilization of commercial payment card services, strong
revenue growth in various electronic payment and information
services, and a steady increase in business-to-business
processing volumes, which more than offset the reduced net
interest margin due to rising rates.
Revenue from capital markets-related products and services,
including mergers and acquisitions advisory activities, was
$283 million for 2006 compared with $175 million for 2005.
The acquisition of Harris Williams in October 2005 together
with improved customer and proprietary trading activities
drove the increase in capital markets revenue in the
comparison.
Midland Loan Services offers servicing, real estate advisory
and technology solutions for the commercial real estate
finance industry. Midland’s revenue, which includes servicing
fees and net interest income from servicing portfolio deposit
balances, totaled $184 million for 2006 and $144 million for
2005. Revenue growth was primarily driven by growth in the
commercial mortgage servicing portfolio and related services.
As a component of our advisory services to clients, we
provide a select set of insurance products to fulfill specific
customer financial needs. Primary insurance offerings include:
• Annuities,
• Life,
• Credit life,
• Health,
• Disability, and
• Commercial lines coverage.
Client segments served by these insurance solutions include
those in Retail Banking and Corporate & Institutional
25