PNC Bank 2006 Annual Report Download - page 118
Download and view the complete annual report
Please find page 118 of the 2006 PNC Bank annual report below. You can navigate through the pages in the report by either clicking on the pages listed below, or by using the keyword search tool below to find specific information within the annual report.-
 1
1 -
2
-
3
-
4
-
5
-
6
-
7
-
8
-
9
-
10
-
11
-
12
-
13
-
14
-
15
-
16
-
17
-
18
-
19
-
20
-
21
-
22
-
23
-
24
-
25
-
26
-
27
-
28
-
29
-
30
-
31
-
32
-
33
-
34
-
35
-
36
-
37
-
38
-
39
-
40
-
41
-
42
-
43
-
44
-
45
-
46
-
47
-
48
-
49
-
50
-
51
-
52
-
53
-
54
-
55
-
56
-
57
-
58
-
59
-
60
-
61
-
62
-
63
-
64
-
65
-
66
-
67
-
68
-
69
-
70
-
71
-
72
-
73
-
74
-
75
-
76
-
77
-
78
-
79
-
80
-
81
-
82
-
83
-
84
-
85
-
86
-
87
-
88
-
89
-
90
-
91
-
92
-
93
-
94
-
95
-
96
-
97
-
98
-
99
-
100
-
101
-
102
-
103
-
104
-
105
-
106
-
107
-
 108
108 -
 109
109 -
 110
110 -
 111
111 -
 112
112 -
 113
113 -
 114
114 -
 115
115 -
 116
116 -
 117
117 -
 118
118 -
 119
119 -
 120
120 -
 121
121 -
 122
122 -
 123
123 -
 124
124 -
 125
125 -
 126
126 -
 127
127 -
 128
128 -
129
-
130
-
131
-
132
-
133
-
134
-
135
-
136
-
137
-
138
-
139
-
140
-
141
-
142
-
143
-
144
-
145
-
146
-
147
 |
 |

N
OTE
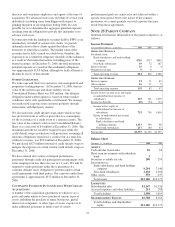
20 I
NCOME
T
AXES
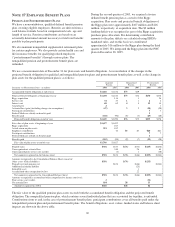
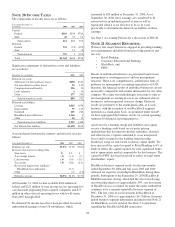
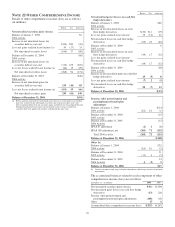
The components of income taxes are as follows:
Year ended December 31
In millions 2006 2005 2004
Current
Federal $565 $550 $720
State 46 53 12
Total current 611 603 732
Deferred
Federal 752 (12) (192)
State 13 (2)
Total deferred 752 1 (194)
Total $1,363 $604 $538
Significant components of deferred tax assets and liabilities
are as follows:
December 31 - in millions 2006 2005
Deferred tax assets
Allowance for loan and lease losses $258 $311
Net unrealized securities losses 52 135
Compensation and benefits 296 56
Loan valuation 610
Other 277 240
Total deferred tax assets 889 752
Deferred tax liabilities
Leasing 1,025 1,078
Depreciation 75 103
Goodwill 205 206
BlackRock basis difference 1,166 6
Other 56 15
Total deferred tax liabilities 2,527 1,408
Net deferred tax liability $1,638 $656
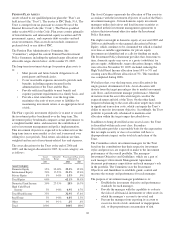
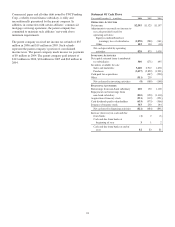
A reconciliation between the statutory and effective tax rates
follows:
Year ended December 31 2006 2005 2004
Statutory tax rate 35.0% 35.0% 35.0%
Increases (decreases) resulting from
State taxes .8 2.1 .4
Tax-exempt interest (.3) (1.1) (.7)
Life insurance (.6) (1.0) (1.1)
Tax credits (.9) (1.8) (2.3)
Reversal of deferred tax liabilities –
BlackRock basis allocation (2.3)
Other (.7) (1.0)
Effective tax rate 34.0% 30.2% 30.3%
At December 31, 2006 we had available $104 million of
federal and $221 million of state income tax net operating loss
carryforwards originating from acquired companies and $73
million in other state net operating losses which will expire
from 2007 through 2026.
No deferred US income taxes have been provided on certain
undistributed earnings of non-US subsidiaries, which
amounted to $39 million at December 31, 2006. As of
September 30, 2006, these earnings are considered to be
reinvested for an indefinite period of time or will be
repatriated when it is tax effective to do so. It is not
practicable to determine the deferred tax liability on these
earnings.
See Note 1 Accounting Policies for a discussion of FIN 48.
N
OTE
21 S
EGMENT
R
EPORTING
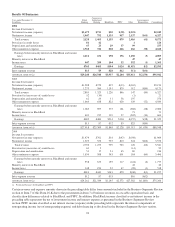
We have four major businesses engaged in providing banking,
asset management and global fund processing products and
services:
• Retail Banking,
• Corporate & Institutional Banking,
• BlackRock, and
• PFPC.
Results of individual businesses are presented based on our
management accounting practices and our management
structure. There is no comprehensive, authoritative body of
guidance for management accounting equivalent to GAAP;
therefore, the financial results of individual businesses are not
necessarily comparable with similar information for any other
company. We refine our methodologies from time to time as
our management accounting practices are enhanced and our
businesses and management structure change. Financial
results are presented, to the extent practicable, as if each
business, with the exception of our BlackRock segment,
operated on a stand-alone basis. As permitted under GAAP,
we have aggregated the business results for certain operating
segments for financial reporting purposes.
Assets receive a funding charge and liabilities and capital
receive a funding credit based on a transfer pricing
methodology that incorporates product maturities, duration
and other factors. Capital is intended to cover unexpected
losses and is assigned to the banking and processing
businesses using our risk-based economic capital model. We
have increased the capital assigned to Retail Banking to 6% of
funds to reflect the capital required for well-capitalized banks
and to approximate market comparables for this business. The
capital for PFPC has been increased to reflect its legal entity
shareholders’ equity.
BlackRock business segment results for the nine months
ended September 30, 2006 and full years 2005 and 2004
reflected our majority ownership in BlackRock during those
periods. Subsequent to the September 29, 2006 BlackRock/
MLIM transaction closing, which had the effect of reducing
our ownership interest to approximately 34%, our investment
in BlackRock was accounted for under the equity method but
continues to be a separate reportable business segment of
PNC. The fair value of our investment in BlackRock at
December 31, 2006 was approximately $6.7 billion. Our prior
period business segment information included in this Note 21
for BlackRock was not restated. See Note 2 Acquisitions
regarding the BlackRock/MLIM transaction.
108