PNC Bank 2006 Annual Report Download - page 32
Download and view the complete annual report
Please find page 32 of the 2006 PNC Bank annual report below. You can navigate through the pages in the report by either clicking on the pages listed below, or by using the keyword search tool below to find specific information within the annual report.-
 1
1 -
2
-
3
-
4
-
5
-
6
-
7
-
8
-
9
-
10
-
11
-
12
-
13
-
14
-
15
-
16
-
17
-
18
-
19
-
20
-
21
-
 22
22 -
 23
23 -
 24
24 -
 25
25 -
 26
26 -
 27
27 -
 28
28 -
 29
29 -
 30
30 -
 31
31 -
 32
32 -
 33
33 -
 34
34 -
 35
35 -
 36
36 -
 37
37 -
 38
38 -
 39
39 -
 40
40 -
 41
41 -
 42
42 -
43
-
44
-
45
-
46
-
47
-
48
-
49
-
50
-
51
-
52
-
53
-
54
-
55
-
56
-
57
-
58
-
59
-
60
-
61
-
62
-
63
-
64
-
65
-
66
-
67
-
68
-
69
-
70
-
71
-
72
-
73
-
74
-
75
-
76
-
77
-
78
-
79
-
80
-
81
-
82
-
83
-
84
-
85
-
86
-
87
-
88
-
89
-
90
-
91
-
92
-
93
-
94
-
95
-
96
-
97
-
98
-
99
-
100
-
101
-
102
-
103
-
104
-
105
-
106
-
107
-
108
-
109
-
110
-
111
-
112
-
113
-
114
-
115
-
116
-
117
-
118
-
119
-
120
-
121
-
122
-
123
-
124
-
125
-
126
-
127
-
128
-
129
-
130
-
131
-
132
-
133
-
134
-
135
-
136
-
137
-
138
-
139
-
140
-
141
-
142
-
143
-
144
-
145
-
146
-
147
 |
 |

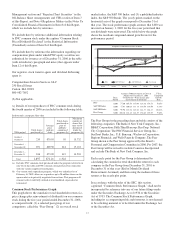
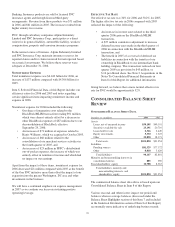
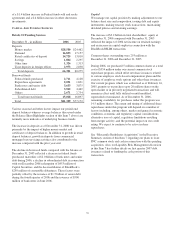
securities. Our third quarter 2006 securities portfolio
rebalancing actions are further described in the Consolidated
Balance Sheet Review section of this Item 7. Securities
comprised 27% of average interest-earning assets for 2006
and 26% for 2005.
Average total deposits were $63.3 billion for 2006 compared
with $57.6 billion for 2005. The increase in average total
deposits was driven primarily by the impact of higher
certificates of deposit, money market account and noninterest-
bearing deposit balances, and by higher Eurodollar deposits.
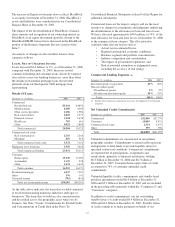
Growth in deposits from commercial mortgage loan servicing
activities also contributed to the increase compared with 2005.
Similar to its impact on average loans and securities described
above, our expansion into the greater Washington, DC area
also contributed to the increase in average total deposits.
Average total deposits represented 67% of total sources of
funds for 2006 and 65% for 2005. Average transaction
deposits were $42.3 billion for 2006 and $39.5 billion for
2005.
Average borrowed funds were $15.0 billion for 2006 and
$16.2 billion for 2005. Commercial paper declined
$2.1 billion in the comparison as 2005 included $1.8 billion of
commercial paper related to Market Street, which was
deconsolidated in October 2005. Apart from the decrease in
commercial paper, average borrowed funds increased
$.9 billion in 2006 compared with the prior year primarily due
to net increases in fed funds purchased.
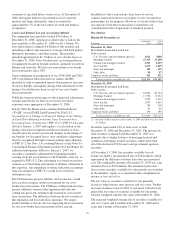
Shareholders’ equity totaled $10.8 billion at December 31,
2006, compared with $8.6 billion at December 31, 2005. The
increase of $2.2 billion in total shareholders’ equity compared
with December 31, 2005 reflected the impact of 2006 net
income on retained earnings and an increase in capital surplus
in connection with the BlackRock/MLIM transaction.
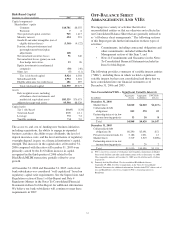
L
INE OF
B
USINESS
H
IGHLIGHTS
We refer you to Item 1 of this Report for an overview of our
business segments in Review of Lines of Business and to the
“Results of Businesses – Summary” table in the Business
Segments Review section of this Item 7. Total business
segment earnings were $1.5 billion for 2006 and $1.4 billion
for 2005.
See Note 21 Segment Reporting in the Notes To Consolidated
Financial Statements in Item 8 of this Report for a
reconciliation of total business segment earnings to total PNC
consolidated earnings as reported on a GAAP basis.
Retail Banking
Retail Banking’s 2006 earnings increased $83 million, or
12%, to $765 million compared with 2005. Revenue increased
9% and noninterest expense increased 6% compared with the
prior year, creating positive operating leverage. The increase
in earnings was driven by improved fee income from
customers, higher taxable-equivalent net interest income
fueled by continued customer and balance sheet growth, and a
sustained focus on expense management. Positive operating
leverage allows for annual earnings growth as well as the
ability to reinvest in the business for future growth.
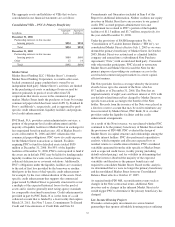
Corporate & Institutional Banking
Earnings from Corporate & Institutional Banking for 2006
totaled $463 million compared with $480 million for 2005.
This decline was primarily attributable to the year-over- year
$72 million change in the provision for credit losses
principally as a result of a $53 million loan recovery
recognized in the second quarter of 2005. The provision for
credit losses was $42 million in 2006. In addition, the
comparison was impacted by a $137 million increase in total
revenue while noninterest expenses grew by $91 million in
2006 compared with 2005.
BlackRock
Our BlackRock business segment earned $187 million for
2006 and $152 million for 2005. These amounts represent
BlackRock’s contribution to PNC’s earnings, including the
impact of minority interest expense, as applicable, and
additional income taxes recognized by PNC related to
BlackRock’s earnings. For our BlackRock business segment
reporting presentation in this Item 7, we have reflected our
portion of the 2006 BlackRock/MLIM integration costs in
“Other” rather than in earnings from our BlackRock
investment. BlackRock business segment earnings for 2006
reflected higher investment advisory and administration fees
due to an increase in assets under management and increased
performance fees. These factors more than offset the increase
in expense due to increased compensation and benefits and
higher general and administration expense, and a one-time
expense of $34 million incurred during the first quarter of
2006 related to the January 2005 acquisition of State Street
Research and Management.
22