PNC Bank 2006 Annual Report Download - page 71
Download and view the complete annual report
Please find page 71 of the 2006 PNC Bank annual report below. You can navigate through the pages in the report by either clicking on the pages listed below, or by using the keyword search tool below to find specific information within the annual report.-
 1
1 -
2
-
3
-
4
-
5
-
6
-
7
-
8
-
9
-
10
-
11
-
12
-
13
-
14
-
15
-
16
-
17
-
18
-
19
-
20
-
21
-
22
-
23
-
24
-
25
-
26
-
27
-
28
-
29
-
30
-
31
-
32
-
33
-
34
-
35
-
36
-
37
-
38
-
39
-
40
-
41
-
42
-
43
-
44
-
45
-
46
-
47
-
48
-
49
-
50
-
51
-
52
-
53
-
54
-
55
-
56
-
57
-
58
-
59
-
60
-
 61
61 -
 62
62 -
 63
63 -
 64
64 -
 65
65 -
 66
66 -
 67
67 -
 68
68 -
 69
69 -
 70
70 -
 71
71 -
 72
72 -
 73
73 -
 74
74 -
 75
75 -
 76
76 -
 77
77 -
 78
78 -
 79
79 -
 80
80 -
 81
81 -
82
-
83
-
84
-
85
-
86
-
87
-
88
-
89
-
90
-
91
-
92
-
93
-
94
-
95
-
96
-
97
-
98
-
99
-
100
-
101
-
102
-
103
-
104
-
105
-
106
-
107
-
108
-
109
-
110
-
111
-
112
-
113
-
114
-
115
-
116
-
117
-
118
-
119
-
120
-
121
-
122
-
123
-
124
-
125
-
126
-
127
-
128
-
129
-
130
-
131
-
132
-
133
-
134
-
135
-
136
-
137
-
138
-
139
-
140
-
141
-
142
-
143
-
144
-
145
-
146
-
147
 |
 |
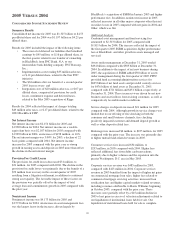
Equity management (private equity) net gains on portfolio
investments totaled $96 million for 2005 and $67 million for
2004.
Net securities losses amounted to $41 million for 2005
compared with net securities gains of $55 million in 2004. In
late April and early May 2005 we sold $2.1 billion of
securities available for sale and terminated $1.0 billion of
resale agreements that were most sensitive to extension risk
due to rising short-term interest rates. We also purchased
$2.1 billion of securities with higher yields and lower
extension risk. These transactions resulted in realized net
securities and other losses of approximately $31 million.
Noninterest revenue from trading activities totaled
$157 million for 2005 and $113 million for 2004. While
customer activity represented the majority of trading revenue,
the increase compared with 2004 was primarily the result of
proprietary trading activities. We provide additional
information on our trading activities under Market Risk
Management – Trading Risk in the Risk Management section
of this Item 7.
Other noninterest income decreased $1 million, to
$372 million, in 2005 compared with 2004. Other noninterest
income typically fluctuates from period to period depending
on the nature and magnitude of transactions completed.
Other noninterest income for 2005 included the following
pretax items:
• A $33 million gain related to contributions of
BlackRock stock to the PNC Foundation,
transactions that also impacted noninterest expense,
and
• Income related to the 2005 SSRM and Riggs
acquisitions.
The factors above offset the impact of the following pretax
gains in 2004:
• A first quarter $34 million gain related to the sale of
our modified coinsurance contracts, and
• A second quarter $13 million gain recognized in
connection with BlackRock’s sale of its interest in
Trepp LLC, a provider of commercial mortgage-
backed security information, analytics and
technology.
Noninterest Expense
Total noninterest expense was $4.306 billion for 2005, an
increase of $594 million compared with 2004. The efficiency
ratio was 68% for 2005 and 67% for 2004.
Noninterest expense for 2005 included the following:
• An increase of $325 million in BlackRock non-LTIP
operating expenses that reflected the impact of costs
resulting from the first quarter 2005 SSRM
acquisition and other investments to fund growth;
• Costs totaling approximately $132 million resulting
from our Riggs acquisition, including approximately
$16 million of integration costs;
• BlackRock LTIP charges of $64 million;
• Implementation costs totaling $53 million related to
the One PNC initiative;
• Contributions of BlackRock stock to the PNC
Foundation of $40 million; and
• Costs totaling $17 million related to the Harris
Williams acquisition.
The effect of these increases was partially offset by cost
reductions of approximately $90 million realized in 2005 from
the One PNC initiative. The impact of the Riggs integration
and One PNC implementation costs was reflected in several
noninterest expense items in the Consolidated Income
Statement.
Noninterest expense of $3.712 billion for 2004 included a
$110 million charge associated with the BlackRock LTIP and
conversion-related and other nonrecurring costs totaling
approximately $11 million related to our acquisition of United
National Bancorp, Inc.
Apart from the impact of these items, noninterest expense
increased $174 million, or 5%, in 2005 compared with 2004.
These higher expenses were driven by investments in our
businesses and increased sales incentives.
E
FFECTIVE
T
AX
R
ATE
Our effective tax rate was 30.2% for 2005 and 30.3% for
2004. The low effective tax rate for 2005 was primarily
attributable to the impact of the reversal of deferred tax
liabilities that year in connection with the transfer of our
ownership in BlackRock described under “Summary Results”
above.
The following favorably impacted the effective tax rate for
2004:
• A reduced state and local tax expense due to tax
benefits of $18 million recorded in connection with
New York state and city audit findings, primarily
associated with BlackRock, and
• A $14 million reduction in income tax expense
following our determination that we no longer
required an income tax reserve related to bank-owned
life insurance.
C
ONSOLIDATED
B
ALANCE
S
HEET
R
EVIEW
Loans
Loans increased $5.6 billion, or 13%, as of December 31,
2005 compared with December 31, 2004. The increase in total
loans reflected the following, in part due to our expansion into
the greater Washington, DC market beginning in May 2005:
• Residential mortgage loans increased $2.5 billion,
and
61