PNC Bank 2006 Annual Report Download - page 45
Download and view the complete annual report
Please find page 45 of the 2006 PNC Bank annual report below. You can navigate through the pages in the report by either clicking on the pages listed below, or by using the keyword search tool below to find specific information within the annual report.-
 1
1 -
2
-
3
-
4
-
5
-
6
-
7
-
8
-
9
-
10
-
11
-
12
-
13
-
14
-
15
-
16
-
17
-
18
-
19
-
20
-
21
-
22
-
23
-
24
-
25
-
26
-
27
-
28
-
29
-
30
-
31
-
32
-
33
-
34
-
 35
35 -
 36
36 -
 37
37 -
 38
38 -
 39
39 -
 40
40 -
 41
41 -
 42
42 -
 43
43 -
 44
44 -
 45
45 -
 46
46 -
 47
47 -
 48
48 -
 49
49 -
 50
50 -
 51
51 -
 52
52 -
 53
53 -
 54
54 -
 55
55 -
56
-
57
-
58
-
59
-
60
-
61
-
62
-
63
-
64
-
65
-
66
-
67
-
68
-
69
-
70
-
71
-
72
-
73
-
74
-
75
-
76
-
77
-
78
-
79
-
80
-
81
-
82
-
83
-
84
-
85
-
86
-
87
-
88
-
89
-
90
-
91
-
92
-
93
-
94
-
95
-
96
-
97
-
98
-
99
-
100
-
101
-
102
-
103
-
104
-
105
-
106
-
107
-
108
-
109
-
110
-
111
-
112
-
113
-
114
-
115
-
116
-
117
-
118
-
119
-
120
-
121
-
122
-
123
-
124
-
125
-
126
-
127
-
128
-
129
-
130
-
131
-
132
-
133
-
134
-
135
-
136
-
137
-
138
-
139
-
140
-
141
-
142
-
143
-
144
-
145
-
146
-
147
 |
 |

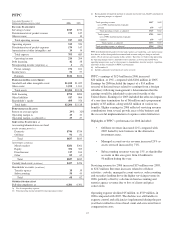
business, such as gains or losses related to our BlackRock
investment, 2006 BlackRock/MLIM integration costs, One
PNC implementation costs, asset and liability management
activities, related net securities gains or losses, certain trading
activities, equity management activities and minority interest
in income of BlackRock up to September 29, 2006,
differences between business segment performance reporting
and financial statement reporting (GAAP), and most corporate
overhead.
Business segment results, including inter-segment revenues,
are included in Note 21 Segment Reporting in the Notes To
Consolidated Financial Statements in Item 8 of this Report.
Employee data as reported by each business segment in the
tables that follow reflect staff directly employed by the
respective businesses and excludes corporate and shared
services employees. Prior period employee statistics generally
are not restated for organizational changes.
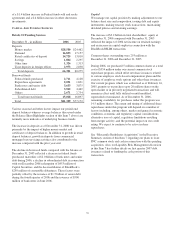
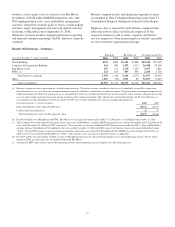
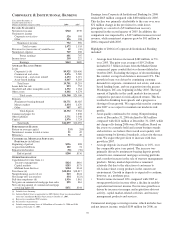
Results Of Businesses - Summary
Earnings Revenue (a) Average Assets (b)
Year ended December 31 - dollars in millions 2006 2005 2006 2005 2006 2005
Retail Banking $765 $682 $3,125 $2,868 $29,248 $27,618
Corporate & Institutional Banking 463 480 1,472 1,335 26,548 25,309
BlackRock (c)(d) 187 152 1,170 1,229 3,937 1,848
PFPC (e) 124 104 879 846 2,204 2,128
Total business segments 1,539 1,418 6,646 6,278 61,937 56,903
Other 1,056 (93) 1,951 82 33,075 31,645
Total consolidated $2,595 $1,325 $8,597 $6,360 $95,012 $88,548
(a) Business segment revenue is presented on a taxable-equivalent basis. The interest income earned on certain assets is completely or partially exempt from
federal income tax. As such, these tax-exempt instruments typically yield lower returns than a taxable investment. To provide more meaningful comparisons of
yields and margins for all interest-earning assets, we also provide revenue on a taxable-equivalent basis by increasing the interest income earned on tax-exempt
assets to make it fully equivalent to interest income earned on other taxable investments. This adjustment is not permitted under GAAP. The following is a
reconciliation of total consolidated revenue on a book (GAAP) basis to total consolidated revenue on a taxable-equivalent basis:
Year ended December 31 - dollars in millions 2006 2005
Total consolidated revenue, book (GAAP) basis $8,572 $6,327
Taxable-equivalent adjustment 25 33
Total consolidated revenue, taxable-equivalent basis $8,597 $6,360
(b) Period-end balances for BlackRock and PFPC. BlackRock was an equity investment at December 31, 2006 and was consolidated at December 31, 2005.
(c) These amounts have been reduced by minority interest in income of BlackRock, excluding MLIM integration costs, totaling $65 million and $71 million for the
years ended December 31, 2006 and 2005, respectively. These amounts are also net of additional PNC income taxes recorded on PNC’s share of BlackRock’s
earnings totaling $24 million and $11 million for the years ended December 31, 2006 and 2005, respectively that have been reclassified to BlackRock from
“Other.” For this PNC business segment earnings presentation, integration costs incurred by BlackRock for the MLIM transaction totaling $47 for full year
2006 have been reclassified from BlackRock to “Other.” This amount is after-tax and net of minority interest as applicable.
(d) For 2005 and the first nine months of 2006, revenue for BlackRock represents the sum of total operating revenue and nonoperating income. For the fourth
quarter of 2006, revenue represents our equity income from BlackRock.
(e) Amounts for PFPC represent the sum of total operating revenue and nonoperating income (expense) less debt financing costs.
35