PNC Bank 2006 Annual Report Download - page 60
Download and view the complete annual report
Please find page 60 of the 2006 PNC Bank annual report below. You can navigate through the pages in the report by either clicking on the pages listed below, or by using the keyword search tool below to find specific information within the annual report.-
 1
1 -
2
-
3
-
4
-
5
-
6
-
7
-
8
-
9
-
10
-
11
-
12
-
13
-
14
-
15
-
16
-
17
-
18
-
19
-
20
-
21
-
22
-
23
-
24
-
25
-
26
-
27
-
28
-
29
-
30
-
31
-
32
-
33
-
34
-
35
-
36
-
37
-
38
-
39
-
40
-
41
-
42
-
43
-
44
-
45
-
46
-
47
-
48
-
49
-
 50
50 -
 51
51 -
 52
52 -
 53
53 -
 54
54 -
 55
55 -
 56
56 -
 57
57 -
 58
58 -
 59
59 -
 60
60 -
 61
61 -
 62
62 -
 63
63 -
 64
64 -
 65
65 -
 66
66 -
 67
67 -
 68
68 -
 69
69 -
 70
70 -
71
-
72
-
73
-
74
-
75
-
76
-
77
-
78
-
79
-
80
-
81
-
82
-
83
-
84
-
85
-
86
-
87
-
88
-
89
-
90
-
91
-
92
-
93
-
94
-
95
-
96
-
97
-
98
-
99
-
100
-
101
-
102
-
103
-
104
-
105
-
106
-
107
-
108
-
109
-
110
-
111
-
112
-
113
-
114
-
115
-
116
-
117
-
118
-
119
-
120
-
121
-
122
-
123
-
124
-
125
-
126
-
127
-
128
-
129
-
130
-
131
-
132
-
133
-
134
-
135
-
136
-
137
-
138
-
139
-
140
-
141
-
142
-
143
-
144
-
145
-
146
-
147
 |
 |

“Accounting by Creditors for Impairment of a Loan.” All
nonperforming loans are considered impaired under SFAS
114. Specific allowances for individual loans over a set dollar
threshold are determined by our Special Asset Committee
based on an analysis of the present value of expected future
cash flows from the loans discounted at their effective interest
rate, observable market price, or the fair value of the
underlying collateral. We establish specific allowance on all
other impaired loans based on the loss given default credit risk
rating.
Allocations to non-impaired commercial and commercial real
estate loans (pool reserve allocations) are assigned to pools of
loans as defined by our business structure and are based on
internal probability of default and loss given default credit risk
ratings.
Key elements of the pool reserve methodology include:
• Probability of default (“PD”), which is based on
historical default analyses and is derived from the
borrower’s internal PD credit risk rating and
expected loan term;
• Exposure at default (“EAD”), which is derived from
historical default data; and
• Loss given default (“LGD”), which is based on
historical loss data, collateral value and other
structural factors that may affect our ultimate ability
to collect on the loan and is derived from the loan’s
internal LGD credit risk rating.
Our pool reserve methodology is sensitive to changes in key
risk parameters such as PDs, LGDs and EADs. In general, a
given change in any of the major risk parameters will have a
corresponding change in the pool reserve allocations for
non-impaired commercial loans. Our commercial loans are the
largest category of credits and are most sensitive to changes in
the key risk parameters and pool reserve loss rates. To
illustrate, if we increase the pool reserve loss rates by 5% for
all categories of non-impaired commercial loans, then the
aggregate of the allowance for loan and lease losses and
allowance for unfunded loan commitments and letters of
credit would increase by $29 million. Additionally, other
factors such as the rate of migration in the severity of problem
loans or changes in the maturity distribution of the loans will
contribute to the final pool reserve allocations.
We make consumer (including residential mortgage) loan
allocations at a total portfolio level by consumer product line
based on historical loss experience. We compute a four-
quarter average loss rate from net charge-offs for the prior
four quarters as a percentage of the average loans outstanding
in those quarters. We apply this loss rate to loans outstanding
at the end of the current period to determine the consumer
loan allocation.
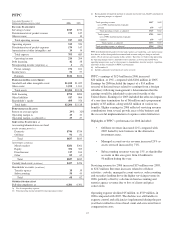
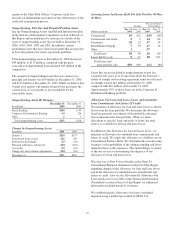
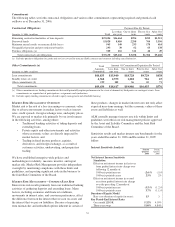
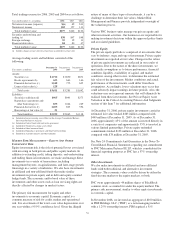
Charge-Offs And Recoveries
Year ended December 31
Dollars in millions Charge-offs Recoveries
Net
Charge-offs
(Recoveries)
Percent of
Average
Loans
2006
Commercial $108 $19 $ 89 .44%
Commercial real estate 3 1 2 .06
Consumer 52 15 37 .23
Residential mortgage 3 3 .04
Lease financing 14 5 9 .32
Total $180 $40 $140 .28
2005
Commercial (a) $ 52 $82 $ (30) (.16)%
Commercial real estate 1 1
Consumer 45 15 30 .19
Residential mortgage 2 2 .03
Lease financing 29 1 28 .95
Total $129 $99 $ 30 .06
(a) Includes a $53 million loan recovery.
We establish reserves to provide coverage for probable losses
not considered in the specific, pool and consumer reserve
methodologies, such as, but not limited to, industry
concentrations and conditions, credit quality trends, recent
loss experience in particular sectors of the portfolio, ability
and depth of lending management, changes in risk selection
and underwriting standards and the timing of available
information. The amount of reserves for these qualitative
factors is assigned to loan categories and to business segments
primarily based on the relative specific and pool allocation
amounts. The amount of reserve allocated for qualitative
factors represented 8.0% of the total allowance and .09% of
total loans at December 31, 2006.
The provision for credit losses for the year ended
December 31, 2006 and the evaluation of the allowances for
loan and lease losses and unfunded loan commitments and
letters of credit as of December 31, 2006 reflected loan
growth, changes in loan portfolio composition, the impact of
refinements to our reserve methodology, and changes in asset
quality. The provision includes amounts for probable losses on
loans and credit exposure related to unfunded loan
commitments and letters of credit.
We do not expect to sustain asset quality at its current level.
However, based on the assets we currently hold and current
business trends and activities, we believe that overall asset
quality will remain strong by historical standards for at least
the near term. This outlook, combined with expected loan
growth, may result in an increase in the allowance for loan
and lease losses in future periods.
The allowance as a percent of nonperforming loans was 381%
and as a percent of total loans was 1.12% at December 31,
50