PNC Bank 2006 Annual Report Download - page 64
Download and view the complete annual report
Please find page 64 of the 2006 PNC Bank annual report below. You can navigate through the pages in the report by either clicking on the pages listed below, or by using the keyword search tool below to find specific information within the annual report.-
 1
1 -
2
-
3
-
4
-
5
-
6
-
7
-
8
-
9
-
10
-
11
-
12
-
13
-
14
-
15
-
16
-
17
-
18
-
19
-
20
-
21
-
22
-
23
-
24
-
25
-
26
-
27
-
28
-
29
-
30
-
31
-
32
-
33
-
34
-
35
-
36
-
37
-
38
-
39
-
40
-
41
-
42
-
43
-
44
-
45
-
46
-
47
-
48
-
49
-
50
-
51
-
52
-
53
-
 54
54 -
 55
55 -
 56
56 -
 57
57 -
 58
58 -
 59
59 -
 60
60 -
 61
61 -
 62
62 -
 63
63 -
 64
64 -
 65
65 -
 66
66 -
 67
67 -
 68
68 -
 69
69 -
 70
70 -
 71
71 -
 72
72 -
 73
73 -
 74
74 -
75
-
76
-
77
-
78
-
79
-
80
-
81
-
82
-
83
-
84
-
85
-
86
-
87
-
88
-
89
-
90
-
91
-
92
-
93
-
94
-
95
-
96
-
97
-
98
-
99
-
100
-
101
-
102
-
103
-
104
-
105
-
106
-
107
-
108
-
109
-
110
-
111
-
112
-
113
-
114
-
115
-
116
-
117
-
118
-
119
-
120
-
121
-
122
-
123
-
124
-
125
-
126
-
127
-
128
-
129
-
130
-
131
-
132
-
133
-
134
-
135
-
136
-
137
-
138
-
139
-
140
-
141
-
142
-
143
-
144
-
145
-
146
-
147
 |
 |

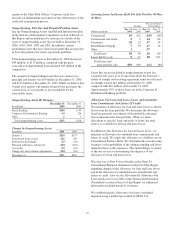
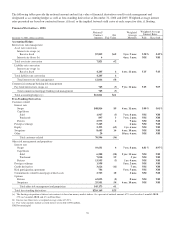
Commitments
The following tables set forth contractual obligations and various other commitments representing required and potential cash
outflows as of December 31, 2006.
Contractual Obligations Payment Due By Period
December 31, 2006 - in millions Total
Less than
one year
One to three
years
Four to five
years
After five
years
Remaining contractual maturities of time deposits $19,024 $16,464 $994 $255 $1,311
Borrowed funds 15,028 8,410 2,298 764 3,556
Minimum annual rentals on noncancellable leases 965 140 233 178 414
Nonqualified pension and post retirement benefits 293 30 62 63 138
Purchase obligations (a) 320 116 111 44 49
Total contractual cash obligations $35,630 $25,160 $3,698 $1,304 $5,468
(a) Includes purchase obligations for goods and services covered by noncancellable contracts and contracts including cancellation fees.
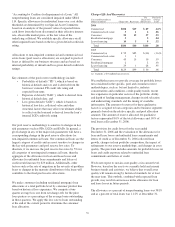
Other Commitments (a) Total
Amounts
Committed
Amount Of Commitment Expiration By Period
December 31, 2006 - in millions
Less than
one year
One to three
years
Four to five
years
After five
years
Loan commitments $44,835 $15,940 $18,728 $9,729 $438
Standby letters of credit 4,360 2,375 1,202 716 67
Other commitments (b) 239 102 56 10 71
Total commitments $49,434 $18,417 $19,986 $10,455 $576
(a) Other commitments are funding commitments that could potentially require performance in the event of demands by third parties or contingent events. Loan
commitments are reported net of participations, assignments and syndications.
(b) Includes equity funding commitments related to equity management and affordable housing.
M
ARKET
R
ISK
M
ANAGEMENT
O
VERVIEW
Market risk is the risk of a loss in earnings or economic value
due to adverse movements in market factors such as interest
rates, credit spreads, foreign exchange rates, and equity prices.
We are exposed to market risk primarily by our involvement
in the following activities, among others:
• Traditional banking activities of taking deposits and
extending loans,
• Private equity and other investments and activities
whose economic values are directly impacted by
market factors, and
• Trading in fixed income products, equities,
derivatives, and foreign exchange, as a result of
customer activities, underwriting, and proprietary
trading.
We have established enterprise-wide policies and
methodologies to identify, measure, monitor, and report
market risk. Market Risk Management provides independent
oversight by monitoring compliance with these limits and
guidelines, and reporting significant risks in the business to
the Joint Risk Committee of the Board.
M
ARKET
R
ISK
M
ANAGEMENT
–I
NTEREST
R
ATE
R
ISK
Interest rate risk results primarily from our traditional banking
activities of gathering deposits and extending loans. Many
factors, including economic and financial conditions,
movements in interest rates, and consumer preferences, affect
the difference between the interest that we earn on assets and
the interest that we pay on liabilities. Because of repricing
term mismatches and embedded options inherent in certain of
these products, changes in market interest rates not only affect
expected near-term earnings, but the economic values of these
assets and liabilities as well.
ALM centrally manages interest rate risk within limits and
guidelines set forth in our risk management policies approved
by the Asset and Liability Committee and the Joint Risk
Committee of the Board.
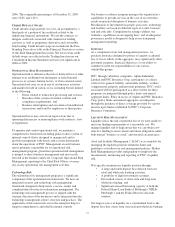
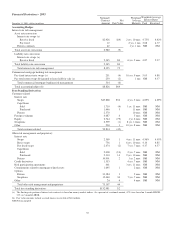
Sensitivity results and market interest rate benchmarks for the
years ended December 31, 2006 and December 31, 2005
follow:
Interest Sensitivity Analysis Fourth
Quarter
2006
Fourth
Quarter
2005
Net Interest Income Sensitivity
Simulation
Effect on net interest income in first year
from gradual interest rate change over
following 12 months of:
100 basis point increase (2.6)% (.5)%
100 basis point decrease 2.5% .2%
Effect on net interest income in second
year from gradual interest rate change
over the preceding 12 months of:
100 basis point increase (5.5)% (1.2)%
100 basis point decrease 3.7% (1.1)%
Duration of Equity Model
Base case duration of equity (in years): 1.5 .3
Key Period-End Interest Rates
One month LIBOR 5.32% 4.39%
Three-year swap 5.10% 4.84%
54