PNC Bank 2006 Annual Report Download - page 53
Download and view the complete annual report
Please find page 53 of the 2006 PNC Bank annual report below. You can navigate through the pages in the report by either clicking on the pages listed below, or by using the keyword search tool below to find specific information within the annual report.-
 1
1 -
2
-
3
-
4
-
5
-
6
-
7
-
8
-
9
-
10
-
11
-
12
-
13
-
14
-
15
-
16
-
17
-
18
-
19
-
20
-
21
-
22
-
23
-
24
-
25
-
26
-
27
-
28
-
29
-
30
-
31
-
32
-
33
-
34
-
35
-
36
-
37
-
38
-
39
-
40
-
41
-
42
-
 43
43 -
 44
44 -
 45
45 -
 46
46 -
 47
47 -
 48
48 -
 49
49 -
 50
50 -
 51
51 -
 52
52 -
 53
53 -
 54
54 -
 55
55 -
 56
56 -
 57
57 -
 58
58 -
 59
59 -
 60
60 -
 61
61 -
 62
62 -
 63
63 -
64
-
65
-
66
-
67
-
68
-
69
-
70
-
71
-
72
-
73
-
74
-
75
-
76
-
77
-
78
-
79
-
80
-
81
-
82
-
83
-
84
-
85
-
86
-
87
-
88
-
89
-
90
-
91
-
92
-
93
-
94
-
95
-
96
-
97
-
98
-
99
-
100
-
101
-
102
-
103
-
104
-
105
-
106
-
107
-
108
-
109
-
110
-
111
-
112
-
113
-
114
-
115
-
116
-
117
-
118
-
119
-
120
-
121
-
122
-
123
-
124
-
125
-
126
-
127
-
128
-
129
-
130
-
131
-
132
-
133
-
134
-
135
-
136
-
137
-
138
-
139
-
140
-
141
-
142
-
143
-
144
-
145
-
146
-
147
 |
 |

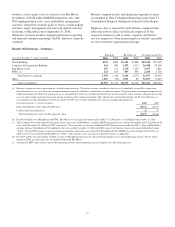
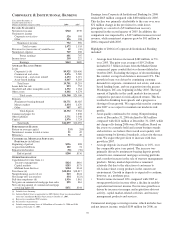
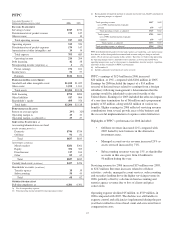
PFPC
Year ended December 31
Dollars in millions except as noted 2006 2005
I
NCOME
S
TATEMENT
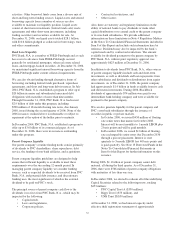
Servicing revenue $747 $732
Distribution/out-of-pocket revenue 170 147
Other revenue 10
Total operating revenue 917 889
Operating expense 519 524
Distribution/out-of-pocket expenses 170 147
Amortization of other intangibles, net 14 14
Total expense 703 685
Operating income 214 204
Debt financing 42 38
Nonoperating income (expense) (a) 4(5)
Pretax earnings 176 161
Income taxes 52 57
Earnings $124 $104
P
ERIOD
-
END
B
ALANCE
S
HEET
Goodwill and other intangible assets $1,012 $1,025
Other assets 1,192 1,103
Total assets $2,204 $2,128
Debt financing $792 $890
Other liabilities 917 864
Shareholder’s equity 495 374
Total funds $2,204 $2,128
P
ERFORMANCE
R
ATIOS
Return on average equity 29% 32%
Operating margin (b) 23 23
Operating margin, as adjusted (c) 29 27
S
ERVICING
S
TATISTICS
(d)
Accounting/administration net fund
assets (
IN BILLIONS
)(e)
Domestic $746 $754
Offshore 91 81
Total $837 $835
Asset type (in billions)
Money market $281 $361
Equity 354 305
Fixed income 117 104
Other 85 65
Total $837 $835
Custody fund assets (in billions) $427 $476
Shareholder accounts (in millions)
Transfer agency 18 19
Subaccounting 50 43
Total 68 62
O
THER INFORMATION
Full-time employees (d) 4,381 4,391
(a) Net of nonoperating expense.
(b) Total operating income divided by total operating revenue.
(c) Reconciliation of reported amounts to amounts used in the non-GAAP calculation of
the operating margin, as adjusted:
Total operating revenue $917 $889
Less: PFPC distribution/out-of-pocket
revenue 170 147
Total operating revenue, as adjusted $747 $742
Total expense $703 $685
Less: PFPC distribution/out-of-pocket
expenses 170 147
Total expense, as adjusted $533 $538
Total operating income, as adjusted $214 $204
PFPC distribution/out-of-pocket revenue and expenses are marketing, sales and servicing
fees that we collect from pooled investment fund accounts and pass along to our fund
clients. We do not earn any margin on this activity. Therefore, we believe that presenting
the operating margin ratio as adjusted for these amounts, as well as the GAAP basis
operating margin ratio, may be of assistance to shareholders, investor analysts, regulators
and others in their evaluation of PFPC’s performance.
(d) At December 31.
(e) Includes alternative investment net assets serviced.
PFPC’s earnings of $124 million in 2006 increased
$20 million, or 19%, compared with $104 million in 2005.
Earnings for 2006 included the impact of a $14 million
reversal of deferred taxes related to earnings from a foreign
subsidiary following management’s determination that the
earnings would be indefinitely reinvested outside of the
United States. Earnings for 2005 included the after-tax impact
of a one time termination fee of $6 million and a prepayment
penalty of $5 million, along with $4 million of various tax
benefits. Higher earnings in 2006 reflected servicing revenue
contributions from several growth areas of the business and
the successful implementation of expense control initiatives.
Highlights of PFPC’s performance in 2006 included:
• Offshore revenues increased 22% compared with
2005 fueled by new business in the alternative
investment arena.
• Managed account service revenue increased 29% as
assets serviced increased by 71%.
• Subaccounting revenues were up 15% as shareholder
accounts in this area grew from 43 million to
50 million during the year.
Servicing revenue for 2006 increased $15 million over 2005,
to $747 million. Revenue increases related to offshore
activities, custody, managed account services, subaccounting
and securities lending drove the higher servicing revenue in
2006, partially offset by a decline in fund accounting and
transfer agency revenue due to loss of clients and price
concessions.
Operating expense declined $5 million, to $519 million, in
2006 compared with 2005. The decline was attributable to
expense control and efficiencies implemented during the past
year that resulted in a lower head count and associated lower
compensation costs.
43