PNC Bank 2006 Annual Report Download - page 115
Download and view the complete annual report
Please find page 115 of the 2006 PNC Bank annual report below. You can navigate through the pages in the report by either clicking on the pages listed below, or by using the keyword search tool below to find specific information within the annual report.-
 1
1 -
2
-
3
-
4
-
5
-
6
-
7
-
8
-
9
-
10
-
11
-
12
-
13
-
14
-
15
-
16
-
17
-
18
-
19
-
20
-
21
-
22
-
23
-
24
-
25
-
26
-
27
-
28
-
29
-
30
-
31
-
32
-
33
-
34
-
35
-
36
-
37
-
38
-
39
-
40
-
41
-
42
-
43
-
44
-
45
-
46
-
47
-
48
-
49
-
50
-
51
-
52
-
53
-
54
-
55
-
56
-
57
-
58
-
59
-
60
-
61
-
62
-
63
-
64
-
65
-
66
-
67
-
68
-
69
-
70
-
71
-
72
-
73
-
74
-
75
-
76
-
77
-
78
-
79
-
80
-
81
-
82
-
83
-
84
-
85
-
86
-
87
-
88
-
89
-
90
-
91
-
92
-
93
-
94
-
95
-
96
-
97
-
98
-
99
-
100
-
101
-
102
-
103
-
104
-
 105
105 -
 106
106 -
 107
107 -
 108
108 -
 109
109 -
 110
110 -
 111
111 -
 112
112 -
 113
113 -
 114
114 -
 115
115 -
 116
116 -
 117
117 -
 118
118 -
 119
119 -
 120
120 -
 121
121 -
 122
122 -
 123
123 -
 124
124 -
 125
125 -
126
-
127
-
128
-
129
-
130
-
131
-
132
-
133
-
134
-
135
-
136
-
137
-
138
-
139
-
140
-
141
-
142
-
143
-
144
-
145
-
146
-
147
 |
 |

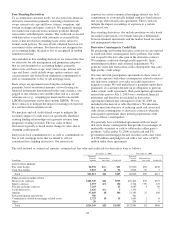
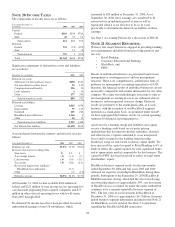
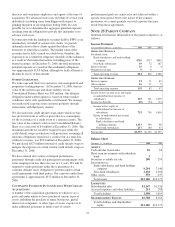
diversify the matching portion of their plan account invested
in shares of PNC common stock into other investments
available within the plan. Prior to this amendment, only
participants age 50 or older were permitted to exercise this
diversification option. Employee benefits expense for this
plan, which was effective July 1, 2004, was $9 million in
2006, $12 million in 2005 and $5 million for 2004. We
measured employee benefits expense as the fair value of the
shares and cash contributed to the plan.
We also maintain a nonqualified supplemental savings plan
for certain employees.
N
OTE
18 S
TOCK
-B
ASED
C
OMPENSATION
P
LANS
We have long-term incentive award plans (“Incentive Plans”)
that provide for the granting of incentive stock options,
nonqualified stock options, stock appreciation rights, incentive
shares/performance units, restricted stock, other share-based
awards and dollar-denominated awards to executives and,
other than incentive stock options, to non-employee directors.
As of December 31, 2006, no incentive stock options or stock
appreciation rights were outstanding.
N
ONQUALIFIED
S
TOCK
O
PTIONS
Options are granted at exercise prices not less than the market
value of common stock on the grant date. Generally, options
granted since 1999 become exercisable in installments after
the grant date. Options granted prior to 1999 are mainly
exercisable 12 months after the grant date. No option may be
exercisable after 10 years from its grant date. Payment of the
option exercise price may be in cash or previously owned
shares of common stock at market value on the exercise date.
Generally, options granted under the Incentive Plans vest
ratably over a three-year period as long as the grantee remains
an employee or, in certain cases, retires from PNC. For all
options granted prior to the adoption of SFAS 123R, we
recognized compensation expense over the three-year vesting
period. If an employee retired prior to the end of the three-
year vesting period, we accelerated the expensing of all
unrecognized compensation costs at the retirement date. As
required under SFAS 123R, we recognize compensation
expense for options granted to retirement-eligible employees
after January 1, 2006 in the period granted, in accordance with
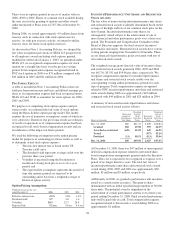
the service period provisions of the options.
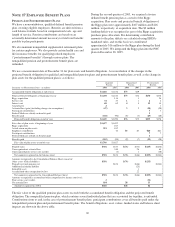
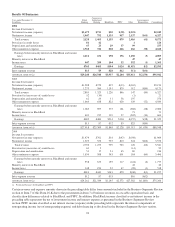
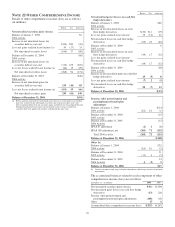
A summary of stock option activity follows:
Per Option
Options outstanding at
December 31
Shares in thousands Exercise Price
Weighted
-Average
Exercise
Price Shares
December 31, 2005 $31.13 – $76.00 $55.30 18,292
Granted 62.71 – 71.38 67.83 2,410
Exercised 31.13 – 66.97 49.32 (5,462)
Forfeited 43.41 – 74.59 66.49 (290)
December 31, 2006 $37.43 – $76.00 $59.29 14,950
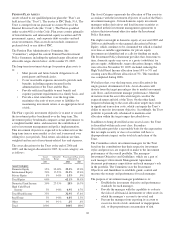
Information about stock options outstanding at December 31, 2006 follows:
Options Outstanding Options Exercisable
December 31, 2006
Shares in thousands
Range of exercise prices Shares
Weighted-average
exercise price
Weighted-average remaining
contractual life (in years) Shares
Weighted-average
exercise price
$37.43 – $42.99 680 $41.60 3.5 680 $41.60
43.00 – 52.99 2,003 46.70 4.9 1,949 46.55
53.00 – 59.99 6,555 55.07 6.1 4,765 55.58
60.00 – 76.00 5,712 70.64 5.5 3,349 72.65
Total 14,950 $59.29 5.6 10,743 $58.38
At December 31, 2006, there were approximately 14,304,000
options in total that were vested and are expected to vest. The
weighted-average grant-date fair value of such options was
$59.19 per share, the weighted-average remaining contractual
life was approximately 5.5 years, and the aggregate intrinsic
value at December 31, 2006 was approximately $219 million.
Options granted in 2005 and 2004 include options for 30,000
shares that were granted to non-employee directors in each
year. No such options were granted in 2006.
The weighted-average grant-date fair value of options granted
in 2006, 2005 and 2004 was $9.94, $8.72 and $9.64 per
option, respectively. At December 31, 2005 and 2004 options
for 13,582,000 and 12,693,000 shares of common stock,
respectively, were exercisable at a weighted-average price of
$56.58 and $56.41, respectively. The total intrinsic value of
options exercised during 2006, 2005 and 2004 was $111
million, $31 million and $17 million, respectively. At
December 31, 2006 the aggregate intrinsic value of all options
outstanding and exercisable was $227 million and $173
million, respectively.
Cash received from option exercises under all Incentive Plans
for 2006, 2005 and 2004 was approximately $233 million, $98
million and $42 million, respectively. The actual tax benefit
realized for tax deduction purposes from option exercises
under all Incentive Plans for 2006, 2005 and 2004 was
approximately $82 million, $34 million and $15 million,
respectively.
105