PNC Bank 2006 Annual Report Download - page 104
Download and view the complete annual report
Please find page 104 of the 2006 PNC Bank annual report below. You can navigate through the pages in the report by either clicking on the pages listed below, or by using the keyword search tool below to find specific information within the annual report.-
 1
1 -
2
-
3
-
4
-
5
-
6
-
7
-
8
-
9
-
10
-
11
-
12
-
13
-
14
-
15
-
16
-
17
-
18
-
19
-
20
-
21
-
22
-
23
-
24
-
25
-
26
-
27
-
28
-
29
-
30
-
31
-
32
-
33
-
34
-
35
-
36
-
37
-
38
-
39
-
40
-
41
-
42
-
43
-
44
-
45
-
46
-
47
-
48
-
49
-
50
-
51
-
52
-
53
-
54
-
55
-
56
-
57
-
58
-
59
-
60
-
61
-
62
-
63
-
64
-
65
-
66
-
67
-
68
-
69
-
70
-
71
-
72
-
73
-
74
-
75
-
76
-
77
-
78
-
79
-
80
-
81
-
82
-
83
-
84
-
85
-
86
-
87
-
88
-
89
-
90
-
91
-
92
-
93
-
 94
94 -
 95
95 -
 96
96 -
 97
97 -
 98
98 -
 99
99 -
 100
100 -
 101
101 -
 102
102 -
 103
103 -
 104
104 -
 105
105 -
 106
106 -
 107
107 -
 108
108 -
 109
109 -
 110
110 -
 111
111 -
 112
112 -
 113
113 -
 114
114 -
115
-
116
-
117
-
118
-
119
-
120
-
121
-
122
-
123
-
124
-
125
-
126
-
127
-
128
-
129
-
130
-
131
-
132
-
133
-
134
-
135
-
136
-
137
-
138
-
139
-
140
-
141
-
142
-
143
-
144
-
145
-
146
-
147
 |
 |

N
OTE
8A
SSET
Q
UALITY
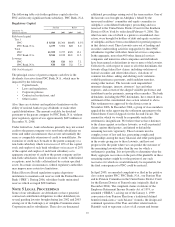
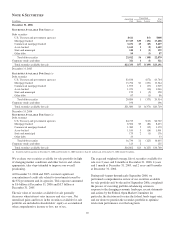
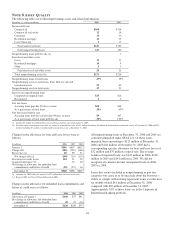
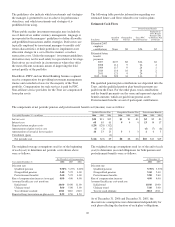
The following table sets forth nonperforming assets and related information:
December 31 - dollars in millions 2006 2005
Nonaccrual loans
Commercial $109 $134
Commercial real estate 12 14
Consumer 13 10
Residential mortgage 12 15
Lease financing 117
Total nonaccrual loans $147 $190
Total nonperforming loans 147 190
Nonperforming loans held for sale (a) 1
Foreclosed and other assets
Lease 12 13
Residential mortgage 10 9
Other 23
Total foreclosed and other assets 24 25
Total nonperforming assets (b) $171 $216
Nonperforming loans to total loans .29% .39%
Nonperforming assets to total loans, loans held for sale and
foreclosed assets .33 .42
Nonperforming assets to total assets .17 .23
Interest on nonperforming loans
Computed on original terms $15 $16
Recognized 45
Past due loans
Accruing loans past due 90 days or more $50 $46
As a percentage of total loans .10% .09%
Past due loans held for sale
Accruing loans held for sale past due 90 days or more $9 $47
As a percentage of total loans held for sale .38% 1.92%
(a) Includes $1 million of troubled debt restructured loans held for sale at December 31, 2005.
(b) Excludes equity management assets that are carried at estimated fair value of $11 million (including $4 million of troubled debt restructured assets) at December 31, 2006 and $25
million (including $7 million of troubled debt restructured assets) at December 31, 2005.
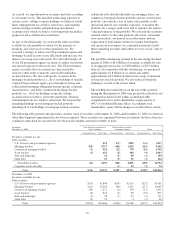
Changes in the allowance for loan and lease losses were as
follows:
In millions 2006 2005 2004
January 1 $596 $607 $632
Charge-offs (180) (129) (166)
Recoveries (a) 40 99 51
Net charge-offs (a) (140) (30) (115)
Provision for credit losses 124 21 52
Acquired allowance (b) 23 22
Net change in allowance for unfunded loan
commitments and letters of credit (20) (25) 16
December 31 $560 $596 $607
(a) Amounts for 2005 reflect the impact of a $53 million loan recovery in that year.
(b) Riggs in 2005 and United National Bancorp in 2004.
Changes in the allowance for unfunded loan commitments and
letters of credit were as follows:
In millions 2006 2005 2004
Allowance at January 1 $100 $75 $91
Net change in allowance for unfunded loan
commitments and letters of credit 20 25 (16)
December 31 $120 $100 $75
All nonperforming loans at December 31, 2006 and 2005 are
considered impaired under SFAS 114. Of these totals,
impaired loans amounting to $121 million at December 31,
2006 and $148 million at December 31, 2005 had a
corresponding specific allowance for loan and lease losses of
$32 million and $37 million, respectively. The average
balance of impaired loans was $147 million in 2006, $106
million in 2005 and $141 million in 2004. We did not
recognize any interest income on impaired loans in 2006,
2005 or 2004.
Loans that are not included in nonperforming or past due
categories but cause us to be uncertain about the borrower’s
ability to comply with existing repayment terms over the next
six months totaled $41 million at December 31, 2006
compared with $67 million at December 31, 2005.
Approximately 59% of these loans are in the Corporate &
Institutional Banking portfolio.
94