PNC Bank 2006 Annual Report Download - page 37
Download and view the complete annual report
Please find page 37 of the 2006 PNC Bank annual report below. You can navigate through the pages in the report by either clicking on the pages listed below, or by using the keyword search tool below to find specific information within the annual report.-
 1
1 -
2
-
3
-
4
-
5
-
6
-
7
-
8
-
9
-
10
-
11
-
12
-
13
-
14
-
15
-
16
-
17
-
18
-
19
-
20
-
21
-
22
-
23
-
24
-
25
-
26
-
 27
27 -
 28
28 -
 29
29 -
 30
30 -
 31
31 -
 32
32 -
 33
33 -
 34
34 -
 35
35 -
 36
36 -
 37
37 -
 38
38 -
 39
39 -
 40
40 -
 41
41 -
 42
42 -
 43
43 -
 44
44 -
 45
45 -
 46
46 -
 47
47 -
48
-
49
-
50
-
51
-
52
-
53
-
54
-
55
-
56
-
57
-
58
-
59
-
60
-
61
-
62
-
63
-
64
-
65
-
66
-
67
-
68
-
69
-
70
-
71
-
72
-
73
-
74
-
75
-
76
-
77
-
78
-
79
-
80
-
81
-
82
-
83
-
84
-
85
-
86
-
87
-
88
-
89
-
90
-
91
-
92
-
93
-
94
-
95
-
96
-
97
-
98
-
99
-
100
-
101
-
102
-
103
-
104
-
105
-
106
-
107
-
108
-
109
-
110
-
111
-
112
-
113
-
114
-
115
-
116
-
117
-
118
-
119
-
120
-
121
-
122
-
123
-
124
-
125
-
126
-
127
-
128
-
129
-
130
-
131
-
132
-
133
-
134
-
135
-
136
-
137
-
138
-
139
-
140
-
141
-
142
-
143
-
144
-
145
-
146
-
147
 |
 |

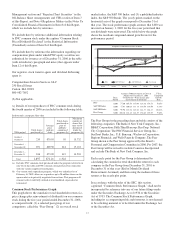
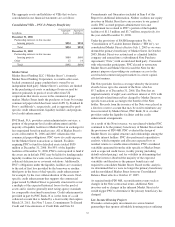
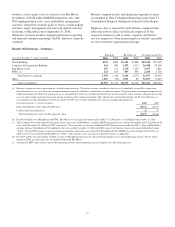
The increase in Equity investments above reflects BlackRock
as an equity investment at December 31, 2006. BlackRock’s
assets and liabilities were consolidated on our Consolidated
Balance Sheet at December 31, 2005.
The impact of the deconsolidation of BlackRock’s balance
sheet amounts and recognition of our ownership interest in
BlackRock as an equity investment upon the closing of the
BlackRock/MLIM transaction is discussed in the BlackRock
portion of the Business Segments Review section of this
Item 7.
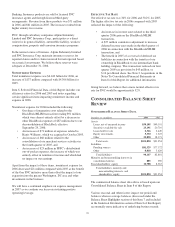
An analysis of changes in selected other balance sheet
categories follows.
L
OANS
,N
ET OF
U
NEARNED
I
NCOME
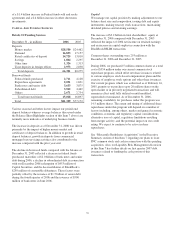
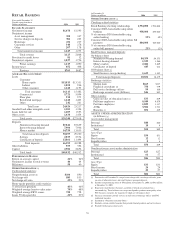
Loans increased $1.0 billion, or 2%, as of December 31, 2006
compared with December 31, 2005. Increases in total
commercial lending and consumer loans, driven by targeted
sales efforts across our banking businesses, more than offset
the decline in residential mortgage loans that resulted
primarily from our third quarter 2006 mortgage loan
repositioning.
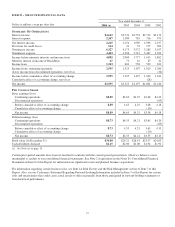
Details Of Loans
December 31 - in millions 2006 2005
Commercial
Retail/wholesale $5,301 $4,854
Manufacturing 4,189 4,045
Other service providers 2,186 1,986
Real estate related 2,825 2,577
Financial services 1,324 1,438
Health care 707 616
Other 4,052 3,809
Total commercial 20,584 19,325
Commercial real estate
Real estate projects 2,716 2,244
Mortgage 816 918
Total commercial real estate 3,532 3,162
Equipment lease financing 3,556 3,628
Total commercial lending 27,672 26,115
Consumer
Home equity 13,749 13,790
Automobile 1,135 938
Other 1,631 1,445
Total consumer 16,515 16,173
Residential mortgage 6,337 7,307
Other 376 341
Unearned income (795) (835)
Total, net of unearned income $50,105 $49,101
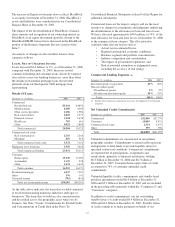
As the table above indicates, the loans that we hold continued
to be diversified among numerous industries and types of
businesses. The loans that we hold are also concentrated in,
and diversified across, the geographic areas where we do
business. See Note 7 Loans, Commitments To Extend Credit
and Concentrations of Credit Risk in the Notes To
Consolidated Financial Statements in Item 8 of this Report for
additional information.
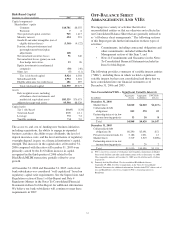
Commercial loans are the largest category and are the most
sensitive to changes in assumptions and judgments underlying
the determination of the allowance for loan and lease losses.
We have allocated approximately $443 million, or 79%, of the
total allowance for loan and lease losses at December 31, 2006
to the commercial loan category. This allocation also
considers other relevant factors such as:
• Actual versus estimated losses,
• Regional and national economic conditions,
• Business segment and portfolio concentrations,
• Industry competition and consolidation,
• The impact of government regulations, and
• Risk of potential estimation or judgmental errors,
including the accuracy of risk ratings.
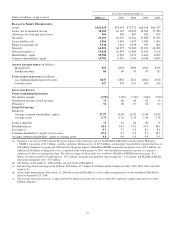
Commercial Lending Exposure (a)
December 31 - in millions 2006 2005
Investment grade or equivalent 49% 46%
Non-investment grade
$50 million or greater 2% 2%
All other non-investment grade 49% 52%
Total 100% 100%
(a) Includes total commercial, commercial real estate, and equipment lease financing
categories.
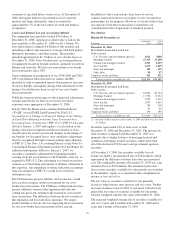
Net Unfunded Credit Commitments
December 31 - in millions 2006 2005
Commercial $31,009 $27,774
Consumer 10,495 9,471
Commercial real estate 2,752 2,337
Other 579 596
Total $44,835 $40,178
Unfunded commitments are concentrated in our primary
geographic markets. Commitments to extend credit represent
arrangements to lend funds or provide liquidity subject to
specified contractual conditions. Commercial commitments
are reported net of participations, assignments and
syndications, primarily to financial institutions, totaling
$8.3 billion at December 31, 2006 and $6.7 billion at
December 31, 2005. Consumer home equity lines of credit
accounted for 74% of consumer unfunded credit
commitments.
Unfunded liquidity facility commitments and standby bond
purchase agreements totaled $6.0 billion at December 31,
2006 and $5.1 billion at December 31, 2005 and are included
in the preceding table primarily within the “Commercial” and
“Consumer” categories.
In addition to credit commitments, our net outstanding
standby letters of credit totaled $4.4 billion at December 31,
2006 and $4.2 billion at December 31, 2005. Standby letters
of credit commit us to make payments on behalf of our
27