PNC Bank 2006 Annual Report Download - page 36
Download and view the complete annual report
Please find page 36 of the 2006 PNC Bank annual report below. You can navigate through the pages in the report by either clicking on the pages listed below, or by using the keyword search tool below to find specific information within the annual report.-
 1
1 -
2
-
3
-
4
-
5
-
6
-
7
-
8
-
9
-
10
-
11
-
12
-
13
-
14
-
15
-
16
-
17
-
18
-
19
-
20
-
21
-
22
-
23
-
24
-
25
-
 26
26 -
 27
27 -
 28
28 -
 29
29 -
 30
30 -
 31
31 -
 32
32 -
 33
33 -
 34
34 -
 35
35 -
 36
36 -
 37
37 -
 38
38 -
 39
39 -
 40
40 -
 41
41 -
 42
42 -
 43
43 -
 44
44 -
 45
45 -
 46
46 -
47
-
48
-
49
-
50
-
51
-
52
-
53
-
54
-
55
-
56
-
57
-
58
-
59
-
60
-
61
-
62
-
63
-
64
-
65
-
66
-
67
-
68
-
69
-
70
-
71
-
72
-
73
-
74
-
75
-
76
-
77
-
78
-
79
-
80
-
81
-
82
-
83
-
84
-
85
-
86
-
87
-
88
-
89
-
90
-
91
-
92
-
93
-
94
-
95
-
96
-
97
-
98
-
99
-
100
-
101
-
102
-
103
-
104
-
105
-
106
-
107
-
108
-
109
-
110
-
111
-
112
-
113
-
114
-
115
-
116
-
117
-
118
-
119
-
120
-
121
-
122
-
123
-
124
-
125
-
126
-
127
-
128
-
129
-
130
-
131
-
132
-
133
-
134
-
135
-
136
-
137
-
138
-
139
-
140
-
141
-
142
-
143
-
144
-
145
-
146
-
147
 |
 |

Banking. Insurance products are sold by licensed PNC
insurance agents and through licensed third-party
arrangements. Revenue from these products was $71 million
in 2006 and $61 million in 2005. The increase resulted from
higher annuity fee revenue.
PNC, through subsidiary companies Alpine Indemnity
Limited and PNC Insurance Corp., participates as a direct
writer for its general liability, automobile liability, workers’
compensation, property and terrorism insurance programs.
In the normal course of business, Alpine Indemnity Limited
and PNC Insurance Corp. maintain insurance reserves for
reported claims and for claims incurred but not reported based
on actuarial assessments. We believe these reserves were
adequate at December 31, 2006.
N
ONINTEREST
E
XPENSE
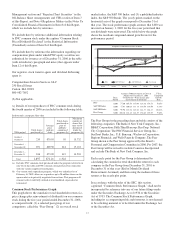
Total noninterest expense was $4.443 billion for 2006, an
increase of $137 million compared with $4.306 billion for
2005.
Item 6, Selected Financial Data, of this Report includes our
efficiency ratios for 2006 and 2005 and notes regarding
certain significant items impacting noninterest income and
expense in 2006.
Noninterest expense for 2006 included the following:
• Our share of integration costs related to the
BlackRock/MLIM transaction totaling $91 million,
which were almost entirely offset by a decrease in
other BlackRock expenses of $87 million due to our
deconsolidation of BlackRock effective
September 29, 2006,
• An increase of $71 million of expenses related to
Harris Williams, which we acquired in October 2005,
• An increase of $60 million related to the
consolidation of our merchant services activities in
the fourth quarter of 2005, and
• An increase of $23 million in PFPC’s distribution/
out-of-pocket expenses, the increase of which was
entirely offset in noninterest income and which had
no impact on our earnings.
Apart from the impact of these items, noninterest expense for
2006 decreased $21 million compared with 2005 as the benefit
of the One PNC initiative more than offset the impact of our
expansion into the greater Washington, DC area and other
investments in the business.
We will have a continued emphasis on expense management
in 2007 as we continue our focus on sustaining positive
operating leverage.
E
FFECTIVE
T
AX
R
ATE
Our effective tax rate was 34% for 2006 and 30.2% for 2005.
The higher effective tax rate in 2006 compared with 2005
reflected the impact of the following:
• An increase in income taxes related to the third
quarter 2006 gain on the BlackRock/MLIM
transaction,
• A $57 million cumulative adjustment to increase
deferred income taxes made in the third quarter of
2006 in connection with the BlackRock/MLIM
transaction, and
• The benefit in 2005 of a reversal of deferred tax
liabilities in connection with the transfer of our
ownership in BlackRock to our intermediate bank
holding company. This transaction reduced our first
quarter 2005 tax provision by $45 million, or
$.16 per diluted share. See Note 2 Acquisitions in the
Notes To Consolidated Financial Statements in
Item 8 of this Report for additional information.
Going forward, we believe that a more normal effective tax
rate for PNC would be approximately 32%.
C
ONSOLIDATED
B
ALANCE
S
HEET
R
EVIEW
S
UMMARIZED
B
ALANCE
S
HEET
D
ATA
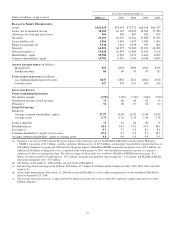
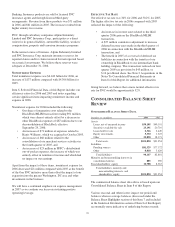
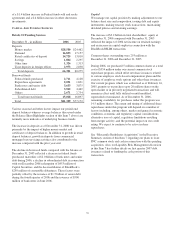
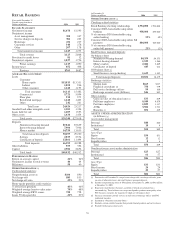
December 31 - in millions 2006 2005
Assets
Loans, net of unearned income $50,105 $49,101
Securities available for sale 23,191 20,710
Loans held for sale 2,366 2,449
Equity investments 5,330 1,323
Other 20,828 18,371
Total assets $101,820 $91,954
Liabilities
Funding sources $81,329 $77,172
Other 8,818 5,629
Total liabilities 90,147 82,801
Minority and noncontrolling interests in
consolidated entities 885 590
Total shareholders’ equity 10,788 8,563
Total liabilities, minority and
noncontrolling interests, and
shareholders’ equity $101,820 $91,954
The summarized balance sheet data above is based upon our
Consolidated Balance Sheet in Item 8 of this Report.
Various seasonal and other factors impact our period-end
balances whereas average balances (discussed under the
Balance Sheet Highlights section of this Item 7 and included
in the Statistical Information section of Item 8 of this Report)
are normally more indicative of underlying business trends.
26