PNC Bank 2006 Annual Report Download - page 3
Download and view the complete annual report
Please find page 3 of the 2006 PNC Bank annual report below. You can navigate through the pages in the report by either clicking on the pages listed below, or by using the keyword search tool below to find specific information within the annual report.-
 1
1 -
 2
2 -
 3
3 -
 4
4 -
 5
5 -
 6
6 -
 7
7 -
 8
8 -
 9
9 -
 10
10 -
 11
11 -
 12
12 -
 13
13 -
 14
14 -
15
-
16
-
17
-
18
-
19
-
20
-
21
-
22
-
23
-
24
-
25
-
26
-
27
-
28
-
29
-
30
-
31
-
32
-
33
-
34
-
35
-
36
-
37
-
38
-
39
-
40
-
41
-
42
-
43
-
44
-
45
-
46
-
47
-
48
-
49
-
50
-
51
-
52
-
53
-
54
-
55
-
56
-
57
-
58
-
59
-
60
-
61
-
62
-
63
-
64
-
65
-
66
-
67
-
68
-
69
-
70
-
71
-
72
-
73
-
74
-
75
-
76
-
77
-
78
-
79
-
80
-
81
-
82
-
83
-
84
-
85
-
86
-
87
-
88
-
89
-
90
-
91
-
92
-
93
-
94
-
95
-
96
-
97
-
98
-
99
-
100
-
101
-
102
-
103
-
104
-
105
-
106
-
107
-
108
-
109
-
110
-
111
-
112
-
113
-
114
-
115
-
116
-
117
-
118
-
119
-
120
-
121
-
122
-
123
-
124
-
125
-
126
-
127
-
128
-
129
-
130
-
131
-
132
-
133
-
134
-
135
-
136
-
137
-
138
-
139
-
140
-
141
-
142
-
143
-
144
-
145
-
146
-
147
 |
 |

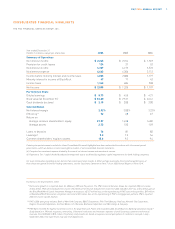
PNC 2006 ANNUAL REPORT 1
Year ended December 31
Dollars in millions, except per share data 2006 2005 2004
Summary of Operations
Net interest income $ 2,245 $ 2,154 $ 1,969
Provision for credit losses 124 21 52
Noninterest income 6,327 4,173 3,572
Noninterest expense 4,443 4,306 3,712
Income before minority interest and income taxes 4,005 2,000 1,777
Minority interest in income of BlackRock 47 71 42
Income taxes 1,363 604 538
Net income $ 2,595 $ 1,325 $ 1,197
Per Common Share
Diluted earnings $ 8.73 $ 4.55 $ 4.21
Book value (at December 31) $ 36.80 $ 29.21 $ 26.41
Cash dividends declared $ 2.15 $ 2.00 $ 2.00
Selected Ratios
Net interest margin 2.92% 3.00% 3.22%
Efficiency(a) 52 68 67
Return on
Average common shareholders’ equity 27.97 16.58 16.82
Average assets 2.73 1.50 1.59
Loans to deposits 76 81 82
Leverage(b) 9.3 7.2 7.6
Common shareholders’ equity to assets 10.6 9.3 9.4
Certain prior-period amounts included in these Consolidated Financial Highlights have been reclassified to conform with the current period
presentation, which we believe is more meaningful to readers of our consolidated financial statements.
(a) Computed as noninterest expense divided by the sum of net interest income and noninterest income.
(b) Represents Tier 1 capital divided by adjusted average total assets as defined by regulatory capital requirements for bank holding companies.
For more information regarding certain factors that could cause future results to differ, perhaps materially, from historical performance or
from those anticipated in forward-looking statements, see the Cautionary Statement in Item 7 of our 2006 Annual Report on Form 10-K.
Footnotes to the Shareholders’ Letter
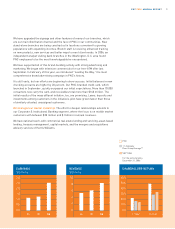
* Net income growth on a reported basis for 2006 over 2005 was 96 percent. The PNC Financial Services Group, Inc. reported 2006 net income
of $2.6 billion. PNC earned adjusted net income of $1.5 billion for the year. Adjusted net income for 2006 excluded, after-tax, a $1.3 billion gain on
the BlackRock/Merrill Lynch Investment Managers transaction, a $127 million loss on the repositioning of PNC’s securities portfolio, $47 million
in BlackRock/MLIM transaction integration costs and a $31 million loss on the repositioning of PNC’s mortgage loan portfolio. PNC’s reported
2005 net income was $1.3 billion.
** PNC’s 2006 peer group includes Bank of New York Company, BB&T Corporation, Fifth Third Bancorp, KeyCorp, National City Corporation,
Regions Financial Corporation, SunTrust Banks, U.S. Bancorp, Wachovia Corporation and Wells Fargo & Company.
***PNC Bank received the highest numerical score in the proprietary J.D. Power and Associates 2006 Small Business Banking Satisfaction Study.SM
Study based on 4,996 total responses, measuring 13 financial institutions and measures opinions of small business customers with annual
revenues from $100,000 to $10 million. Proprietary study results are based on experiences and perceptions of customers surveyed in July –
September 2006. Your experiences may vary. Visit jdpower.com.
CONSOLIDATED FINANCIAL HIGHLIGHTS
THE PNC FINANCIAL SERVICES GROUP, INC.