PNC Bank 2006 Annual Report Download - page 39
Download and view the complete annual report
Please find page 39 of the 2006 PNC Bank annual report below. You can navigate through the pages in the report by either clicking on the pages listed below, or by using the keyword search tool below to find specific information within the annual report.-
 1
1 -
2
-
3
-
4
-
5
-
6
-
7
-
8
-
9
-
10
-
11
-
12
-
13
-
14
-
15
-
16
-
17
-
18
-
19
-
20
-
21
-
22
-
23
-
24
-
25
-
26
-
27
-
28
-
 29
29 -
 30
30 -
 31
31 -
 32
32 -
 33
33 -
 34
34 -
 35
35 -
 36
36 -
 37
37 -
 38
38 -
 39
39 -
 40
40 -
 41
41 -
 42
42 -
 43
43 -
 44
44 -
 45
45 -
 46
46 -
 47
47 -
 48
48 -
 49
49 -
50
-
51
-
52
-
53
-
54
-
55
-
56
-
57
-
58
-
59
-
60
-
61
-
62
-
63
-
64
-
65
-
66
-
67
-
68
-
69
-
70
-
71
-
72
-
73
-
74
-
75
-
76
-
77
-
78
-
79
-
80
-
81
-
82
-
83
-
84
-
85
-
86
-
87
-
88
-
89
-
90
-
91
-
92
-
93
-
94
-
95
-
96
-
97
-
98
-
99
-
100
-
101
-
102
-
103
-
104
-
105
-
106
-
107
-
108
-
109
-
110
-
111
-
112
-
113
-
114
-
115
-
116
-
117
-
118
-
119
-
120
-
121
-
122
-
123
-
124
-
125
-
126
-
127
-
128
-
129
-
130
-
131
-
132
-
133
-
134
-
135
-
136
-
137
-
138
-
139
-
140
-
141
-
142
-
143
-
144
-
145
-
146
-
147
 |
 |
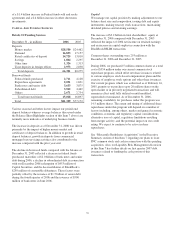
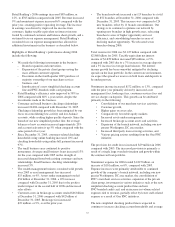
We estimate that at December 31, 2006 the effective duration
of securities available for sale is 2.6 years for an immediate
50 basis points parallel increase in interest rates and 2.2 years
for an immediate 50 basis points parallel decrease in interest
rates. Comparable amounts at December 31, 2005 were
2.7 years and 2.4 years, respectively.
We evaluate our portfolio of securities available for sale in
light of changing market conditions and other factors and,
where appropriate, take steps intended to improve our overall
positioning.
During mid-August through early September 2006, we
performed a comprehensive review of our securities available
for sale portfolio and, by the end of September 2006,
completed the process of executing portfolio rebalancing
actions in response to the changing economic landscape,
recent statements and actions by the Federal Open Market
Committee (in particular, the decision not to raise the Fed
funds target rate), and our desire to position the securities
portfolio to optimize total return performance over the long
term.
As a result, we repositioned our securities portfolio according
to our market views. This included reallocating exposure to
certain sectors, selling securities holdings we believed would
likely underperform on a relative value basis, and retaining
certain existing securities and purchasing incremental
securities all of which we believe will outperform the market
going forward as further discussed below.
As part of the rebalancing, we assessed the entire securities
available for sale portfolio of which, for the majority of
positions, fair value was less than amortized cost. We
executed a strategy to reduce our US government agency and
mortgage-backed security sector allocations and increase our
interest rate swap sector allocation. We sold substantially all
of our US government agency securities to reduce our interest
rate spread exposure to that asset class. The US government
agency securities that we retained are characterized by
relatively short terms to maturity and smaller individual
security balances. We also sold specific securities in the
mortgage-backed portfolio (i.e., all of our holdings of specific
coupon US government agency pass-through securities and
collateralized mortgage obligations having specific collateral
characteristics), and in the commercial mortgage-backed
portfolio (i.e., all of our holdings of specific vintage
securities) that we believe, given the underlying collateral,
will underperform on a relative value basis. We retained the
remaining holdings in our mortgage-backed portfolio
including all of our holdings of mortgage-backed securities
collateralized by hybrid adjustable rate mortgage loans, our
commercial mortgage-backed portfolio and our asset-backed
portfolio. Our objective was to reduce the portfolio credit
spread and interest rate volatility exposures, to position the
portfolio for a steeper yield curve and to optimize the relative
value performance of the portfolio. We assessed the securities
retained relative to the same portfolio objectives, our market
view and outlook, our desired sector allocations and our
expectation of performance relative to market benchmarks,
and, given our assessment, we confirmed our intent to hold
these remaining securities until either recovery of fair value or
maturity.
The portfolio rebalancing resulted in the sale during the third
quarter of 2006 of $6.0 billion of securities available for sale
at an aggregate pretax loss of $196 million, or $127 million
after-tax. In connection with this rebalancing, we purchased
approximately $1.8 billion of securities and added
approximately $4.0 billion of interest rate swaps to maintain
our interest rate risk position. We also reduced wholesale
funding as a result of the actions taken.
The resulting net realized losses on the sale of the securities
during the third quarter of 2006 were previously reflected as
net unrealized securities losses within accumulated other
comprehensive loss in the shareholders’ equity section of
PNC’s Consolidated Balance Sheet. Accordingly, total
shareholders’ equity did not change as a result of these
actions.
See the Consolidated Income Statement Review portion of the
2005 Versus 2004 section of this Item 7 for details of steps
taken in the second quarter of 2005 regarding the sale of
securities available for sale and related actions.
L
OANS
H
ELD
F
OR
S
ALE
During the third quarter of 2006, we announced our plan to
sell or securitize approximately $2.1 billion of loans from our
residential mortgage portfolio. These transactions were
substantially consummated during the fourth quarter of 2006.
In accordance with GAAP, these loans were transferred to
loans held for sale as of September 30, 2006. We recognized a
pretax loss in the third quarter of 2006 of $48 million as a
reduction of noninterest income, representing the mark to
market valuation of these loans upon transfer to held for sale
status. This loss, which is reported in the “Other” business
segment, represented the decline in value of the loans almost
entirely from the impact of increases in interest rates over the
holding period.
Education loans held for sale totaled $1.3 billion at
December 31, 2006 and $1.9 billion at December 31, 2005
and represented the majority of our loans held for sale at each
date. We classify substantially all of our education loans as
loans held for sale. Generally, we sell education loans when
the loans are placed into repayment status. Gains on sales of
education loans totaled $33 million for 2006, $19 million for
2005 and $30 million for 2004. These gains are reflected in
the other noninterest income line item in our Consolidated
Income Statement and in the results of the Retail Banking
business segment.
O
THER
A
SSETS
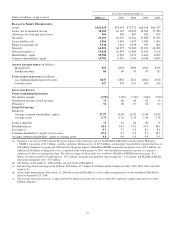
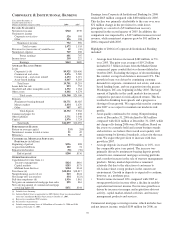
The increase of $2.5 billion in “Assets-Other” in the preceding
“Summarized Balance Sheet Data” table includes the impact
29