PNC Bank 2006 Annual Report Download - page 41
Download and view the complete annual report
Please find page 41 of the 2006 PNC Bank annual report below. You can navigate through the pages in the report by either clicking on the pages listed below, or by using the keyword search tool below to find specific information within the annual report.-
 1
1 -
2
-
3
-
4
-
5
-
6
-
7
-
8
-
9
-
10
-
11
-
12
-
13
-
14
-
15
-
16
-
17
-
18
-
19
-
20
-
21
-
22
-
23
-
24
-
25
-
26
-
27
-
28
-
29
-
30
-
 31
31 -
 32
32 -
 33
33 -
 34
34 -
 35
35 -
 36
36 -
 37
37 -
 38
38 -
 39
39 -
 40
40 -
 41
41 -
 42
42 -
 43
43 -
 44
44 -
 45
45 -
 46
46 -
 47
47 -
 48
48 -
 49
49 -
 50
50 -
 51
51 -
52
-
53
-
54
-
55
-
56
-
57
-
58
-
59
-
60
-
61
-
62
-
63
-
64
-
65
-
66
-
67
-
68
-
69
-
70
-
71
-
72
-
73
-
74
-
75
-
76
-
77
-
78
-
79
-
80
-
81
-
82
-
83
-
84
-
85
-
86
-
87
-
88
-
89
-
90
-
91
-
92
-
93
-
94
-
95
-
96
-
97
-
98
-
99
-
100
-
101
-
102
-
103
-
104
-
105
-
106
-
107
-
108
-
109
-
110
-
111
-
112
-
113
-
114
-
115
-
116
-
117
-
118
-
119
-
120
-
121
-
122
-
123
-
124
-
125
-
126
-
127
-
128
-
129
-
130
-
131
-
132
-
133
-
134
-
135
-
136
-
137
-
138
-
139
-
140
-
141
-
142
-
143
-
144
-
145
-
146
-
147
 |
 |

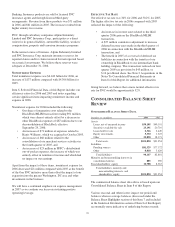
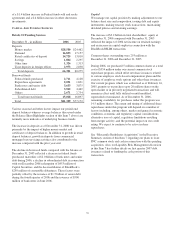
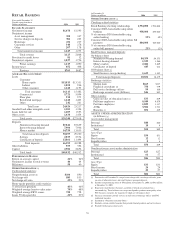
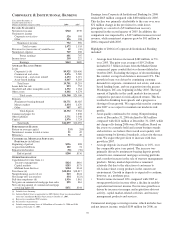
Risk-Based Capital
December 31 - dollars in millions 2006 2005
Capital components
Shareholders’ equity
Common $10,781 $8,555
Preferred 78
Trust preferred capital securities 965 1,417
Minority interest 494 291
Goodwill and other intangibles (net of
eligible deferred taxes) (3,540) (4,122)
Pension, other postretirement and
postemployment benefit plan
adjustments 148
Net unrealized securities losses 91 240
Net unrealized losses (gains) on cash
flow hedge derivatives 13 26
Equity investments in nonfinancial
companies (30) (40)
Other, net (5) (11)
Tier 1 risk-based capital 8,924 6,364
Subordinated debt 1,954 2,216
Eligible allowance for credit losses 681 697
Total risk-based capital $11,559 $9,277
Assets
Risk-weighted assets, including
off-balance-sheet instruments and
market risk equivalent assets $85,539 $76,673
Adjusted average total assets 95,590 88,329
Capital ratios
Tier 1 risk-based 10.4% 8.3%
Total risk-based 13.5 12.1
Leverage 9.3 7.2
Tangible common 7.4 5.0
The access to, and cost of, funding new business initiatives
including acquisitions, the ability to engage in expanded
business activities, the ability to pay dividends, the level of
deposit insurance costs, and the level and nature of regulatory
oversight depend, in part, on a financial institution’s capital
strength. The increases in the capital ratios at December 31,
2006 compared with the ratios at December 31, 2005 were
primarily caused by the $1.6 billion increase in capital
recognized in the third quarter of 2006 related to the
BlackRock/MLIM transaction, partially offset by asset
growth.
At December 31, 2006 and December 31, 2005, each of our
bank subsidiaries was considered “well capitalized” based on
regulatory capital ratio requirements. See the Supervision And
Regulation section of Item 1 of this Report and Note 4
Regulatory Matters in the Notes To Consolidated Financial
Statements in Item 8 of this Report for additional information.
We believe our bank subsidiaries will continue to meet these
requirements in 2007.
O
FF
-B
ALANCE
S
HEET
A
RRANGEMENTS
A
ND
VIE
S
We engage in a variety of activities that involve
unconsolidated entities or that are otherwise not reflected in
our Consolidated Balance Sheet that are generally referred to
as “off-balance sheet arrangements.” The following sections
of this Report provide further information on these types of
activities:
• Commitments, including contractual obligations and
other commitments, included within the Risk
Management section of this Item 7, and
• Note 24 Commitments and Guarantees in the Notes
To Consolidated Financial Statements included in
Item 8 of this Report.
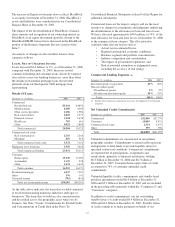
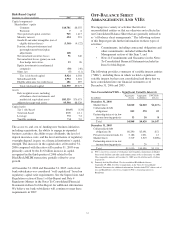
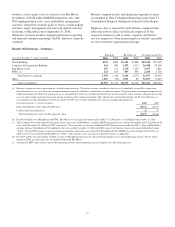
The following provides a summary of variable interest entities
(“VIEs”), including those in which we hold a significant
variable interest but have not consolidated and those that we
have consolidated into our financial statements as of
December 31, 2006 and 2005.
Non-Consolidated VIEs – Significant Variable Interests
In millions
Aggregate
Assets
Aggregate
Liabilities
PNC Risk
of Loss
December 31, 2006
Market Street $4,020 $4,020 $6,117(a)
Collateralized debt
obligations 815 570 22
Partnership interests in low
income housing projects 33 30 8
Total $4,868 $4,620 $6,147
December 31, 2005
Collateralized debt
obligations (b) $6,290 $5,491 $51
Private investment funds (b) 5,186 1,051 13
Market Street 3,519 3,519 5,089(a)
Partnership interests in low
income housing projects 35 29 2
Total $15,030 $10,090 $5,155
(a) PNC’s risk of loss consists of off-balance sheet liquidity commitments to Market
Street of $5.6 billion and other credit enhancements of $.6 at December 31, 2006.
The comparable amounts at December 31, 2005 were $4.6 billion and $.4 billion,
respectively.
(b) Primarily held by BlackRock. We deconsolidated BlackRock effective
September 29, 2006. See Note 2 Acquisitions in the Notes To Consolidated
Financial Statements for additional information. Includes both PNC’s direct risk of
loss and BlackRock’s risk of loss, limited to PNC’s ownership interest in
BlackRock.
31