PNC Bank 2006 Annual Report Download - page 59
Download and view the complete annual report
Please find page 59 of the 2006 PNC Bank annual report below. You can navigate through the pages in the report by either clicking on the pages listed below, or by using the keyword search tool below to find specific information within the annual report.-
 1
1 -
2
-
3
-
4
-
5
-
6
-
7
-
8
-
9
-
10
-
11
-
12
-
13
-
14
-
15
-
16
-
17
-
18
-
19
-
20
-
21
-
22
-
23
-
24
-
25
-
26
-
27
-
28
-
29
-
30
-
31
-
32
-
33
-
34
-
35
-
36
-
37
-
38
-
39
-
40
-
41
-
42
-
43
-
44
-
45
-
46
-
47
-
48
-
 49
49 -
 50
50 -
 51
51 -
 52
52 -
 53
53 -
 54
54 -
 55
55 -
 56
56 -
 57
57 -
 58
58 -
 59
59 -
 60
60 -
 61
61 -
 62
62 -
 63
63 -
 64
64 -
 65
65 -
 66
66 -
 67
67 -
 68
68 -
 69
69 -
70
-
71
-
72
-
73
-
74
-
75
-
76
-
77
-
78
-
79
-
80
-
81
-
82
-
83
-
84
-
85
-
86
-
87
-
88
-
89
-
90
-
91
-
92
-
93
-
94
-
95
-
96
-
97
-
98
-
99
-
100
-
101
-
102
-
103
-
104
-
105
-
106
-
107
-
108
-
109
-
110
-
111
-
112
-
113
-
114
-
115
-
116
-
117
-
118
-
119
-
120
-
121
-
122
-
123
-
124
-
125
-
126
-
127
-
128
-
129
-
130
-
131
-
132
-
133
-
134
-
135
-
136
-
137
-
138
-
139
-
140
-
141
-
142
-
143
-
144
-
145
-
146
-
147
 |
 |

reports to the Chief Risk Officer. Corporate Audit also
provides an independent assessment of the effectiveness of the
credit risk management process.
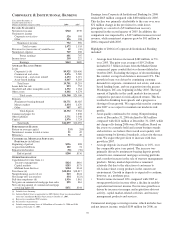
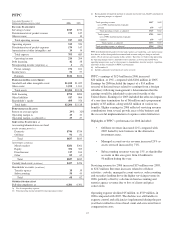
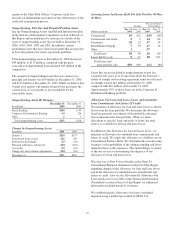
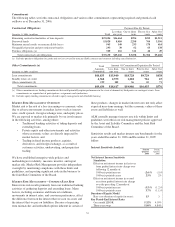
Nonperforming, Past Due And Potential Problem Assets
See the Nonperforming Assets And Related Information table
in the Statistical Information (Unaudited) section of Item 8 of
this Report and included here by reference for details of the
types of nonperforming assets that we held at December 31,
2006, 2005, 2004, 2003 and 2002. In addition, certain
performing assets that have interest payments that are past due
or have the potential for future repayment problems.
Total nonperforming assets at December 31, 2006 decreased
$45 million, to $171 million, compared with the prior
year-end as nonperforming loans declined $43 million in the
comparison.
The amount of nonperforming loans that was current as to
principal and interest was $59 million at December 31, 2006
and $115 million at December 31, 2005. While we believe that
overall asset quality will remain strong for the near term, the
current level of asset quality is not sustainable for the
foreseeable future.
Nonperforming Assets By Business
In millions
December 31
2006
December 31
2005
Retail Banking $106 $90
Corporate & Institutional Banking 63 124
Other 22
Total nonperforming assets $171 $216
Change In Nonperforming Assets
In millions 2006 2005
January 1 $216 $175
Transferred from accrual 225 340
Returned to performing (17) (10)
Principal reductions and payoffs (116) (183)
Asset sales (17) (16)
Charge-offs and valuation adjustments (120) (90)
December 31 $171 $216
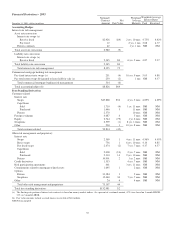
Accruing Loans And Loans Held For Sale Past Due 90 Days
Or More
Amount
Percent of Total
Outstandings
Dollars in millions
Dec. 31
2006
Dec. 31
2005
Dec. 31
2006
Dec. 31
2005
Commercial $9 $12 .04% .06%
Commercial real estate 52.14 .06
Consumer 28 22 .17 .14
Residential mortgage 710 .11 .14
Other 1 .27
Total loans 50 46 .10 .09
Loans held for sale 947 .38 1.92
Total loans and
loans held for sale $59 $93 .11% .18%
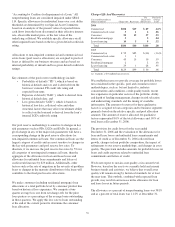
Loans that are not included in nonperforming or past due
categories but cause us to be uncertain about the borrower’s
ability to comply with existing repayment terms over the next
six months totaled $41 million at December 31, 2006,
compared with $67 million at December 31, 2005.
Approximately 59% of these loans are in the Corporate &
Institutional Banking portfolio.
Allowances For Loan And Lease Losses And Unfunded
Loan Commitments And Letters Of Credit
We maintain an allowance for loan and lease losses to absorb
losses from the loan portfolio. We determine the allowance
based on quarterly assessments of the probable estimated
losses inherent in the loan portfolio. While we make
allocations to specific loans and pools of loans, the total
reserve is available for all loan and lease losses.
In addition to the allowance for loan and lease losses, we
maintain an allowance for unfunded loan commitments and
letters of credit. We report this allowance as a liability on our
Consolidated Balance Sheet. We determine this amount using
estimates of the probability of the ultimate funding and losses
related to those credit exposures. This methodology is similar
to the one we use for determining the adequacy of our
allowance for loan and lease losses.
We refer you to Note 8 Asset Quality in the Notes To
Consolidated Financial Statements in Item 8 of this Report
regarding changes in the allowance for loan and lease losses
and in the allowance for unfunded loan commitments and
letters of credit. Also see the Allocation Of Allowance For
Loan And Lease Losses table in the Statistical Information
(Unaudited) section of Item 8 of this Report for additional
information included herein by reference.
We establish specific allowances for loans considered
impaired using a method prescribed by SFAS 114,
49