PNC Bank 2006 Annual Report Download - page 33
Download and view the complete annual report
Please find page 33 of the 2006 PNC Bank annual report below. You can navigate through the pages in the report by either clicking on the pages listed below, or by using the keyword search tool below to find specific information within the annual report.-
 1
1 -
2
-
3
-
4
-
5
-
6
-
7
-
8
-
9
-
10
-
11
-
12
-
13
-
14
-
15
-
16
-
17
-
18
-
19
-
20
-
21
-
22
-
 23
23 -
 24
24 -
 25
25 -
 26
26 -
 27
27 -
 28
28 -
 29
29 -
 30
30 -
 31
31 -
 32
32 -
 33
33 -
 34
34 -
 35
35 -
 36
36 -
 37
37 -
 38
38 -
 39
39 -
 40
40 -
 41
41 -
 42
42 -
 43
43 -
44
-
45
-
46
-
47
-
48
-
49
-
50
-
51
-
52
-
53
-
54
-
55
-
56
-
57
-
58
-
59
-
60
-
61
-
62
-
63
-
64
-
65
-
66
-
67
-
68
-
69
-
70
-
71
-
72
-
73
-
74
-
75
-
76
-
77
-
78
-
79
-
80
-
81
-
82
-
83
-
84
-
85
-
86
-
87
-
88
-
89
-
90
-
91
-
92
-
93
-
94
-
95
-
96
-
97
-
98
-
99
-
100
-
101
-
102
-
103
-
104
-
105
-
106
-
107
-
108
-
109
-
110
-
111
-
112
-
113
-
114
-
115
-
116
-
117
-
118
-
119
-
120
-
121
-
122
-
123
-
124
-
125
-
126
-
127
-
128
-
129
-
130
-
131
-
132
-
133
-
134
-
135
-
136
-
137
-
138
-
139
-
140
-
141
-
142
-
143
-
144
-
145
-
146
-
147
 |
 |

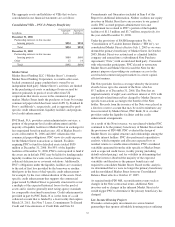
For 2004, 2005 and the nine months ended September 30,
2006, our Consolidated Income Statement included our former
69%-71% ownership interest in BlackRock’s net income
through the BlackRock/MLIM transaction closing date.
However, beginning September 30, 2006, our Consolidated
Balance Sheet no longer reflected the consolidation of
BlackRock’s balance sheet but recognized our 34% ownership
interest in BlackRock as an investment accounted for under
the equity method. Our share of BlackRock’s net income is
now reported within asset management noninterest income in
our Consolidated Income Statement.
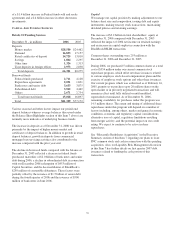
PFPC
PFPC’s earnings of $124 million in 2006 increased
$20 million, or 19%, compared with $104 million in 2005.
Earnings for 2006 included the impact of a $14 million
reversal of deferred taxes related to earnings from a foreign
subsidiary following management’s determination that the
earnings would be indefinitely reinvested outside of the
United States. Earnings for 2005 included the after-tax impact
of a one-time termination fee of $6 million and a prepayment
penalty of $5 million, along with $4 million of various tax
benefits. Higher earnings in 2006 reflected servicing revenue
contributions from several growth areas of the business and
the successful implementation of expense control initiatives.
Other
“Other” earnings for 2006 totaled $1.1 billion, while “Other”
2005 was a net loss of $93 million. “Other” earnings for 2006
included the $1.3 billion after-tax gain on the BlackRock/
MLIM transaction recorded in the third quarter of 2006,
partially offset by the impact of charges related to the
following, on an after-tax basis:
• Third quarter 2006 balance sheet repositioning
activities amounting to $158 million, and
• BlackRock/MLIM integration costs of $47 million.
“Other” for 2005 included the impact of implementation costs
related to the One PNC initiative totaling $35 million after-
tax, net securities losses of $27 million after-tax, and Riggs
acquisition integration costs totaling $20 million after-tax.
These factors were partially offset by the first quarter 2005
benefit recognized from a $45 million deferred tax liability
reversal related to the internal transfer of our investment in
BlackRock as described above under Summary Financial
Results.
C
ONSOLIDATED
I
NCOME
S
TATEMENT
R
EVIEW
N
ET
I
NTEREST
I
NCOME
-O
VERVIEW
Changes in net interest income and margin result from the
interaction of the volume and composition of interest-earning
assets and related yields, interest-bearing liabilities and related
rates paid, and noninterest-bearing sources.
See Statistical Information – Analysis of Year-To-Year
Changes In Net Interest Income and Average Consolidated
Balance Sheet and Net Interest Analysis in Item 8 of this
Report for additional information.
N
ET
I
NTEREST
I
NCOME
- GAAP R
ECONCILIATION
The interest income earned on certain assets is completely or
partially exempt from federal income tax. As such, these
tax-exempt instruments typically yield lower returns than a
taxable investment. To provide more meaningful comparisons
of yields and margins for all interest-earning assets, we also
provide net interest income on a taxable-equivalent basis by
increasing the interest income earned on tax-exempt assets to
make it fully equivalent to interest income earned on other
taxable investments. This adjustment is not permitted under
GAAP.
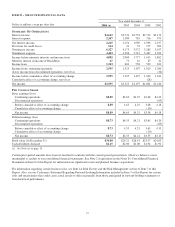
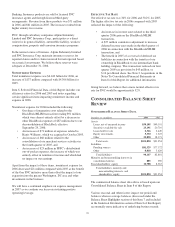
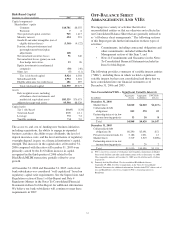
A reconciliation of net interest income as reported in the
Consolidated Income Statement (GAAP basis) to net interest
income on a taxable-equivalent basis follows (in millions):
For the year ended December 31,
2006 2005 2004
Net interest income, GAAP basis $2,245 $2,154 $1,969
Taxable-equivalent adjustment 25 33 20
Net interest income, taxable-
equivalent basis $2,270 $2,187 $1,989
Taxable-equivalent net interest income increased $83 million,
or 4%, in 2006 compared with 2005. The increase reflected
the impact of the 6% increase in average interest-earning
assets during 2006 partially offset by a decline in the net
interest margin as further described below.
N
ET
I
NTEREST
M
ARGIN
The net interest margin was 2.92% in 2006 compared with
3.00% for 2005, an 8 basis point decline. The following
factors contributed to the decline in net interest margin in
2006:
• An increase in the average rate paid on interest-
bearing deposits of 104 basis points for 2006
compared with the 2005 period. The average rate
paid on money market accounts, the largest single
component of interest-bearing deposits, increased
111 basis points.
• An increase in the average rate paid on borrowed
funds of 147 basis points for 2006 compared with
2005.
23