PNC Bank 2006 Annual Report Download - page 48
Download and view the complete annual report
Please find page 48 of the 2006 PNC Bank annual report below. You can navigate through the pages in the report by either clicking on the pages listed below, or by using the keyword search tool below to find specific information within the annual report.-
 1
1 -
2
-
3
-
4
-
5
-
6
-
7
-
8
-
9
-
10
-
11
-
12
-
13
-
14
-
15
-
16
-
17
-
18
-
19
-
20
-
21
-
22
-
23
-
24
-
25
-
26
-
27
-
28
-
29
-
30
-
31
-
32
-
33
-
34
-
35
-
36
-
37
-
 38
38 -
 39
39 -
 40
40 -
 41
41 -
 42
42 -
 43
43 -
 44
44 -
 45
45 -
 46
46 -
 47
47 -
 48
48 -
 49
49 -
 50
50 -
 51
51 -
 52
52 -
 53
53 -
 54
54 -
 55
55 -
 56
56 -
 57
57 -
 58
58 -
59
-
60
-
61
-
62
-
63
-
64
-
65
-
66
-
67
-
68
-
69
-
70
-
71
-
72
-
73
-
74
-
75
-
76
-
77
-
78
-
79
-
80
-
81
-
82
-
83
-
84
-
85
-
86
-
87
-
88
-
89
-
90
-
91
-
92
-
93
-
94
-
95
-
96
-
97
-
98
-
99
-
100
-
101
-
102
-
103
-
104
-
105
-
106
-
107
-
108
-
109
-
110
-
111
-
112
-
113
-
114
-
115
-
116
-
117
-
118
-
119
-
120
-
121
-
122
-
123
-
124
-
125
-
126
-
127
-
128
-
129
-
130
-
131
-
132
-
133
-
134
-
135
-
136
-
137
-
138
-
139
-
140
-
141
-
142
-
143
-
144
-
145
-
146
-
147
 |
 |
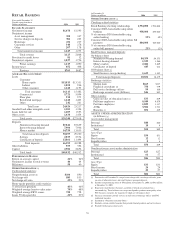
balances per account. Two features of the new product line,
free access to ATMs worldwide and a first time overdraft fee
waiver, will, however, negatively impact growth rates on
service charges on deposits fee income and noninterest
expenses.
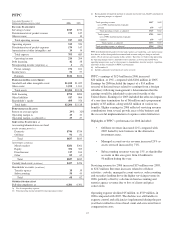
Full-time employees at December 31, 2006 totaled 9,549, a
decline of 130 from December 31, 2005. Part-time employees
have increased by 712 since December 31, 2005. The decline
in full-time employees and increase in part-time employees is
a direct result of various customer service enhancement and
efficiency initiatives. These initiatives include utilizing more
part-time customer-facing employees during peak business
hours versus full-time employees for the entire day.
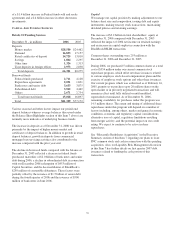
We have adopted a relationship-based lending strategy to
target specific customer sectors (homeowners, small
businesses and auto dealerships) while seeking to maintain a
moderate risk profile in the loan portfolio.
• Average commercial loans grew $627 million, or 12%,
on the strength of increased loan demand from existing
small business customers and the acquisition of new
relationships through our sales efforts.
• Average home equity loans grew by $462 million, or 3%,
compared with 2005. Consumer loan demand has slowed
as a result of the current rate environment.
• Average indirect loans grew $116 million, or 12%,
compared with 2005. The indirect auto business benefited
from increased sales and marketing efforts.
• Average residential mortgage loans increased
$35 million, or 2%, primarily due to the addition of loans
from our new greater Washington, DC area market.
Payoffs in our existing portfolio, which will continue
throughout 2007, reduced the impact of the additional
loans acquired. Additionally, our transfer of residential
mortgages to held for sale and subsequent sale of those
loans at the end of September reduced the size of this
loan portfolio.
Growing core checking deposits as a lower cost-funding
source and as the cornerstone product to build customer
relationships is the primary objective of our deposit strategy.
Average total deposits increased $3.1 billion, or 7%,
compared with 2005. The deposit growth was driven by
increases in the number of checking relationships and the
recapture of consumer certificate of deposit balances as
interest rates have risen.
During the current rate environment, we expect the rate of
growth in demand deposit balances to be equal to or less than
the rate of overall growth for customer checking relationships.
Additionally, we expect to see customers shift their funds
from lower yielding interest-bearing deposits to higher
yielding deposits or investment products, and to pay off loans.
The shift has been evident during the past year and has
impacted the level of average demand deposits in that period.
• Certificates of deposits increased $2.4 billion and money
market deposits increased $1.1 billion. These increases
were attributable to the current interest rate environment
attracting customers back into these products.
• Average demand deposit growth of $162 million, or 1%,
was impacted by customers shifting funds into higher
yielding deposits, small business sweep checking
products, and investment products.
• Small business and consumer-related checking
relationships retention remained strong and stable.
Consumer-related checking relationship retention has
benefited from improved penetration rates of debit cards,
online banking and online bill payment.
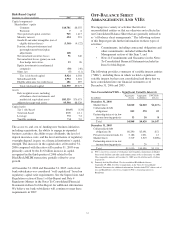
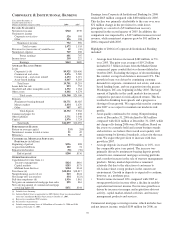
Assets under management of $54 billion at December 31,
2006 increased $5 billion compared with the balance at
December 31, 2005. Asset growth was driven by the effect of
comparatively higher equity markets combined with a
breakeven position in client net asset flows. Client net asset
flows are the result of investment additions from new and
existing clients net of ordinary course distributions from trust
and investment management accounts and account closures.
Nondiscretionary assets under administration of $86 billion at
December 31, 2006 increased $2 billion compared with the
balance at December 31, 2005. The effect of comparatively
higher equity markets was partially offset by the loss of one
significant master custody account and a sizeable reduction of
another client account with minimal earnings impact.
38