PNC Bank 2006 Annual Report Download - page 70
Download and view the complete annual report
Please find page 70 of the 2006 PNC Bank annual report below. You can navigate through the pages in the report by either clicking on the pages listed below, or by using the keyword search tool below to find specific information within the annual report.-
 1
1 -
2
-
3
-
4
-
5
-
6
-
7
-
8
-
9
-
10
-
11
-
12
-
13
-
14
-
15
-
16
-
17
-
18
-
19
-
20
-
21
-
22
-
23
-
24
-
25
-
26
-
27
-
28
-
29
-
30
-
31
-
32
-
33
-
34
-
35
-
36
-
37
-
38
-
39
-
40
-
41
-
42
-
43
-
44
-
45
-
46
-
47
-
48
-
49
-
50
-
51
-
52
-
53
-
54
-
55
-
56
-
57
-
58
-
59
-
 60
60 -
 61
61 -
 62
62 -
 63
63 -
 64
64 -
 65
65 -
 66
66 -
 67
67 -
 68
68 -
 69
69 -
 70
70 -
 71
71 -
 72
72 -
 73
73 -
 74
74 -
 75
75 -
 76
76 -
 77
77 -
 78
78 -
 79
79 -
 80
80 -
81
-
82
-
83
-
84
-
85
-
86
-
87
-
88
-
89
-
90
-
91
-
92
-
93
-
94
-
95
-
96
-
97
-
98
-
99
-
100
-
101
-
102
-
103
-
104
-
105
-
106
-
107
-
108
-
109
-
110
-
111
-
112
-
113
-
114
-
115
-
116
-
117
-
118
-
119
-
120
-
121
-
122
-
123
-
124
-
125
-
126
-
127
-
128
-
129
-
130
-
131
-
132
-
133
-
134
-
135
-
136
-
137
-
138
-
139
-
140
-
141
-
142
-
143
-
144
-
145
-
146
-
147
 |
 |

2005 V
ERSUS
2004
C
ONSOLIDATED
I
NCOME
S
TATEMENT
R
EVIEW
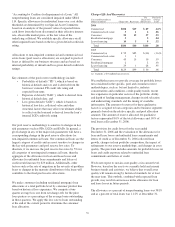
Summary Results
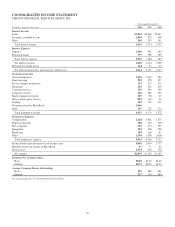
Consolidated net income for 2005 was $1.325 billion or $4.55
per diluted share and for 2004 was $1.197 billion or $4.21 per
diluted share.
Results for 2005 included the impact of the following items:
• The reversal of deferred tax liabilities that benefited
earnings by $45 million, or $.16 per diluted share, in
the first quarter related to our transfer of ownership
in BlackRock from PNC Bank, N.A. to our
intermediate bank holding company, PNC Bancorp,
Inc.;
• Implementation costs totaling $35 million after-tax,
or $.12 per diluted share, related to the One PNC
initiative;
• The $34 million after-tax benefit of a second quarter
2005 loan recovery; and
• Integration costs of $20 million after-tax, or $.07 per
diluted share, comprised of provision for credit
losses, noninterest expense and deferred taxes,
related to the May 2005 acquisition of Riggs.
Results for 2004 reflected the impact of charges totaling
$49 million after taxes, or $.17 per diluted share, related to the
2002 BlackRock LTIP.
Net Interest Income
Net interest income was $2.154 billion for 2005 and
$1.969 billion for 2004. Net interest income on a taxable-
equivalent basis was $2.187 billion for 2005 compared with
$1.989 billion in 2004, an increase of $198 million, or 10%.
The net interest margin was 3.00% for 2005, a decline of 22
basis points compared with 2004. Net interest income
increased in 2005 compared with the prior year as strong
growth in earning assets and deposits in 2005 more than offset
the decline in the net interest margin.
Provision For Credit Losses
The provision for credit losses decreased $31 million, to
$21 million, for 2005 compared with 2004. The decline in the
provision for credit losses was primarily due to the benefit of a
$53 million loan recovery in the second quarter of 2005
resulting from a litigation settlement, in addition to continued
strong asset quality. The favorable impact of these factors on
the provision was partially offset by the impact of total
average loan and commitments growth in 2005 compared with
the prior year.
Noninterest Income
Noninterest income was $4.173 billion for 2005 and
$3.572 billion for 2004. An increase in asset management fees
was the largest factor in the increase, driven largely by
BlackRock’s acquisition of SSRM in January 2005 and higher
performance fees. In addition, noninterest income in 2005
reflected increases in all other major categories other than net
securities losses in 2005 compared with net gains in 2004 and
Other, which was flat.
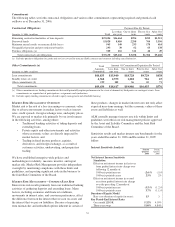
Additional Analysis
Combined asset management and fund servicing fees
amounted to $2.313 billion for 2005 compared with
$1.811 billion for 2004. The increase reflected the impact of
the first quarter 2005 SSRM acquisition, higher performance
fees at BlackRock, and other growth in assets managed and
serviced.
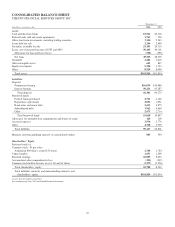
Assets under management at December 31, 2005 totaled
$494 billion compared with $383 billion at December 31,
2004. In addition to the impact of net new business during
2005, the acquisition of SSRM added $50 billion of assets
under management during the first quarter of 2005. PFPC
provided fund accounting/administration services for
$835 billion of net fund assets and provided custody services
for $476 billion of fund assets at December 31, 2005,
compared with $721 billion and $451 billion, respectively, at
December 31, 2004. These increases were driven by net new
business and asset inflows from existing customers, as well as
comparatively favorable market conditions.
Service charges on deposits increased $21 million for 2005
compared with 2004. Although growth in service charges was
limited due to our offering of free checking in both the
consumer and small business channels, free checking
positively impacted customer and demand deposit growth as
well as other deposit-related fees.
Brokerage fees increased $6 million, to $225 million, for 2005
compared with the prior year. The increase was primarily due
to higher mutual fund-related revenues in 2005.
Consumer services fees increased $34 million, to
$293 million, in 2005 compared with 2004. Higher fees
reflected additional fees from debit card transactions,
primarily due to higher volumes and the expansion into the
greater Washington, D.C. area in May 2005.
Corporate services revenue was $485 million for 2005,
compared with $423 million in 2004. Corporate services
revenue in 2005 benefited from the impact of higher net gains
on commercial mortgage loan sales, higher fees related to
commercial mortgage servicing activities, increased loan
syndication fees and higher capital markets-related revenues,
including revenues attributable to Harris Williams beginning
in October 2005, compared with the prior year. These
increases were partially offset by a $45 million decline in
2005 of net gains in excess of valuation adjustments related to
our liquidation of institutional loans held for sale. Our
liquidation of institutional loans held for sale is complete.
60