PNC Bank 2006 Annual Report Download - page 46
Download and view the complete annual report
Please find page 46 of the 2006 PNC Bank annual report below. You can navigate through the pages in the report by either clicking on the pages listed below, or by using the keyword search tool below to find specific information within the annual report.-
 1
1 -
2
-
3
-
4
-
5
-
6
-
7
-
8
-
9
-
10
-
11
-
12
-
13
-
14
-
15
-
16
-
17
-
18
-
19
-
20
-
21
-
22
-
23
-
24
-
25
-
26
-
27
-
28
-
29
-
30
-
31
-
32
-
33
-
34
-
35
-
 36
36 -
 37
37 -
 38
38 -
 39
39 -
 40
40 -
 41
41 -
 42
42 -
 43
43 -
 44
44 -
 45
45 -
 46
46 -
 47
47 -
 48
48 -
 49
49 -
 50
50 -
 51
51 -
 52
52 -
 53
53 -
 54
54 -
 55
55 -
 56
56 -
57
-
58
-
59
-
60
-
61
-
62
-
63
-
64
-
65
-
66
-
67
-
68
-
69
-
70
-
71
-
72
-
73
-
74
-
75
-
76
-
77
-
78
-
79
-
80
-
81
-
82
-
83
-
84
-
85
-
86
-
87
-
88
-
89
-
90
-
91
-
92
-
93
-
94
-
95
-
96
-
97
-
98
-
99
-
100
-
101
-
102
-
103
-
104
-
105
-
106
-
107
-
108
-
109
-
110
-
111
-
112
-
113
-
114
-
115
-
116
-
117
-
118
-
119
-
120
-
121
-
122
-
123
-
124
-
125
-
126
-
127
-
128
-
129
-
130
-
131
-
132
-
133
-
134
-
135
-
136
-
137
-
138
-
139
-
140
-
141
-
142
-
143
-
144
-
145
-
146
-
147
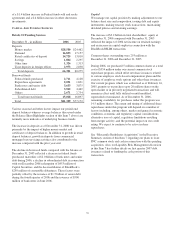
 |
 |

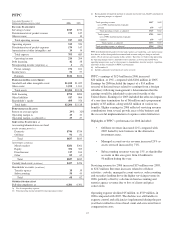
R
ETAIL
B
ANKING
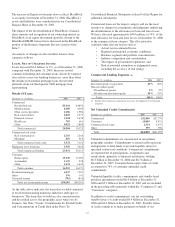
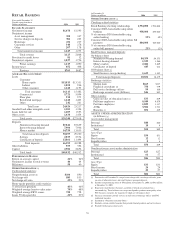
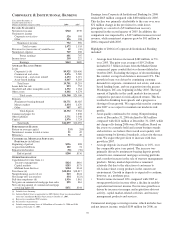
Year ended December 31
Taxable-equivalent basis
Dollars in millions 2006 2005
I
NCOME
S
TATEMENT
Net interest income $1,678 $1,593
Noninterest income
Asset management 352 337
Service charges on deposits 304 265
Brokerage 236 217
Consumer services 348 278
Other 207 178
Total noninterest income 1,447 1,275
Total revenue 3,125 2,868
Provision for credit losses 81 52
Noninterest expense 1,827 1,726
Pretax earnings 1,217 1,090
Income taxes 452 408
Earnings $765 $682
A
VERAGE
B
ALANCE
S
HEET
Loans
Consumer
Home equity $13,813 $13,351
Indirect 1,052 936
Other consumer 1,248 1,195
Total consumer 16,113 15,482
Commercial 5,721 5,094
Floor plan 910 975
Residential mortgage 1,440 1,405
Other 242 261
Total loans 24,426 23,217
Goodwill and other intangible assets 1,581 1,394
Loans held for sale 1,607 1,553
Other assets 1,634 1,454
Total assets $29,248 $27,618
Deposits
Noninterest-bearing demand $7,841 $7,639
Interest-bearing demand 7,906 7,946
Money market 14,750 13,635
Total transaction deposits 30,497 29,220
Savings 2,035 2,574
Certificates of deposit 13,861 11,494
Total deposits 46,393 43,288
Other liabilities 553 392
Capital 2,986 2,852
Total funds $49,932 $46,532
P
ERFORMANCE
R
ATIOS
Return on average capital 26% 24%
Noninterest income to total revenue 46 44
Efficiency 58 60
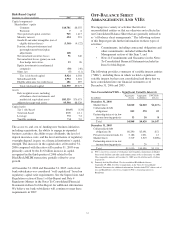
O
THER
I
NFORMATION
(a)
Credit-related statistics:
Nonperforming assets (b) $106 $90
Net charge-offs $85 $53
Net charge-off ratio .35% .23%
Home equity portfolio credit statistics:
% of first lien positions 43% 46%
Weighted average loan-to-value ratios 70% 68%
Weighted average FICO scores 728 728
Loans 90 days past due .24% .21%
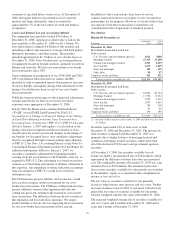
At December 31
Dollars in millions 2006 2005
O
THER
I
NFORMATION
(a)
Checking-related statistics:
Retail Banking checking relationships 1,954,000 1,934,000
Consumer DDA households using online
banking 938,000 855,000
% of consumer DDA households using
online banking 53% 49%
Consumer DDA households using online bill
payment 404,000 205,000
% of consumer DDA households using
online bill payment 23% 12%
Small business managed deposits:
On-balance sheet
Noninterest-bearing demand $4,359 $4,353
Interest-bearing demand 1,529 1,560
Money market 2,684 2,849
Certificates of deposit 645 412
Off-balance sheet (c)
Small business sweep checking 1,619 1,305
Total managed deposits 10,836 10,479
Brokerage statistics:
Margin loans $163 $217
Financial consultants (d) 758 779
Full service brokerage offices 99 100
Brokerage account assets (billions) $46 $42
Other statistics:
Gains on sales of education loans (e) $33 $19
Full-time employees 9,549 9,679
Part time employees 1,829 1,117
ATMs 3,581 3,721
Branches (f) 852 839
ASSETS UNDER ADMINISTRATION
(in billions) (g)
Assets under management
Personal $44 $40
Institutional 10 9
Total $54 $49
Asset Type
Equity $34 $31
Fixed income 12 12
Liquidity/other 86
Total $54 $49
Nondiscretionary assets under administration
Personal $25 $27
Institutional 61 57
Total $86 $84
Asset Type
Equity $33 $33
Fixed income 24 24
Liquidity/other 29 27
Total $86 $84
(a) Presented as of December 31 except for net charge-offs, net charge-off ratio, gains
on sales of education loans, and small business managed deposits.
(b) Includes nonperforming loans of $96 million at December 31, 2006 and $81 million
at December 31, 2005.
(c) Represents small business balances, a portion of which are calculated on a
one-month lag. These balances are swept into liquidity products managed by other
PNC business segments, the majority of which are off-balance sheet.
(d) Financial consultants provide services in full service brokerage offices and PNC
traditional branches.
(e) Included in “Noninterest income-Other.”
(f) Excludes certain satellite branches that provide limited products and service hours.
(g) Excludes brokerage account assets.
36