PNC Bank 2006 Annual Report Download - page 50
Download and view the complete annual report
Please find page 50 of the 2006 PNC Bank annual report below. You can navigate through the pages in the report by either clicking on the pages listed below, or by using the keyword search tool below to find specific information within the annual report.-
 1
1 -
2
-
3
-
4
-
5
-
6
-
7
-
8
-
9
-
10
-
11
-
12
-
13
-
14
-
15
-
16
-
17
-
18
-
19
-
20
-
21
-
22
-
23
-
24
-
25
-
26
-
27
-
28
-
29
-
30
-
31
-
32
-
33
-
34
-
35
-
36
-
37
-
38
-
39
-
 40
40 -
 41
41 -
 42
42 -
 43
43 -
 44
44 -
 45
45 -
 46
46 -
 47
47 -
 48
48 -
 49
49 -
 50
50 -
 51
51 -
 52
52 -
 53
53 -
 54
54 -
 55
55 -
 56
56 -
 57
57 -
 58
58 -
 59
59 -
 60
60 -
61
-
62
-
63
-
64
-
65
-
66
-
67
-
68
-
69
-
70
-
71
-
72
-
73
-
74
-
75
-
76
-
77
-
78
-
79
-
80
-
81
-
82
-
83
-
84
-
85
-
86
-
87
-
88
-
89
-
90
-
91
-
92
-
93
-
94
-
95
-
96
-
97
-
98
-
99
-
100
-
101
-
102
-
103
-
104
-
105
-
106
-
107
-
108
-
109
-
110
-
111
-
112
-
113
-
114
-
115
-
116
-
117
-
118
-
119
-
120
-
121
-
122
-
123
-
124
-
125
-
126
-
127
-
128
-
129
-
130
-
131
-
132
-
133
-
134
-
135
-
136
-
137
-
138
-
139
-
140
-
141
-
142
-
143
-
144
-
145
-
146
-
147
 |
 |
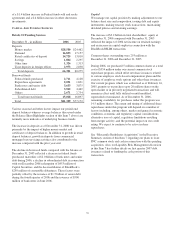
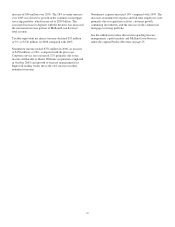
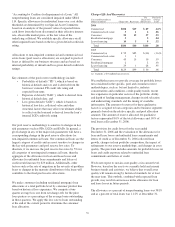
increase of $40 million over 2005. The 28% revenue increase
over 2005 was driven by growth in the commercial mortgage
servicing portfolio, which increased to $200 billion. The
associated increase in deposits with the business has increased
the net interest income portion of Midland Loan Services’
total revenue.
Taxable-equivalent net interest income declined $19 million,
or 3%, to $720 million, in 2006 compared with 2005.
Noninterest income totaled $752 million in 2006, an increase
of $156 million, or 26%, compared with the prior year.
Corporate service fees increased 32% primarily due to fee
income attributable to Harris Williams (acquisition completed
in October 2005) and growth of treasury management fees.
Improved trading results drove the 14% increase in other
noninterest income.
Noninterest expense increased 14% compared with 2005. The
increases in noninterest expense and full-time employees were
primarily due to acquisition activity, customer growth,
continuing investments, and the increase in the commercial
mortgage servicing portfolio.
See the additional revenue discussion regarding treasury
management, capital markets and Midland Loan Services
under the caption Product Revenue on page 25.
40