PNC Bank 2006 Annual Report Download - page 28
Download and view the complete annual report
Please find page 28 of the 2006 PNC Bank annual report below. You can navigate through the pages in the report by either clicking on the pages listed below, or by using the keyword search tool below to find specific information within the annual report.-
 1
1 -
2
-
3
-
4
-
5
-
6
-
7
-
8
-
9
-
10
-
11
-
12
-
13
-
14
-
15
-
16
-
17
-
 18
18 -
 19
19 -
 20
20 -
 21
21 -
 22
22 -
 23
23 -
 24
24 -
 25
25 -
 26
26 -
 27
27 -
 28
28 -
 29
29 -
 30
30 -
 31
31 -
 32
32 -
 33
33 -
 34
34 -
 35
35 -
 36
36 -
 37
37 -
 38
38 -
39
-
40
-
41
-
42
-
43
-
44
-
45
-
46
-
47
-
48
-
49
-
50
-
51
-
52
-
53
-
54
-
55
-
56
-
57
-
58
-
59
-
60
-
61
-
62
-
63
-
64
-
65
-
66
-
67
-
68
-
69
-
70
-
71
-
72
-
73
-
74
-
75
-
76
-
77
-
78
-
79
-
80
-
81
-
82
-
83
-
84
-
85
-
86
-
87
-
88
-
89
-
90
-
91
-
92
-
93
-
94
-
95
-
96
-
97
-
98
-
99
-
100
-
101
-
102
-
103
-
104
-
105
-
106
-
107
-
108
-
109
-
110
-
111
-
112
-
113
-
114
-
115
-
116
-
117
-
118
-
119
-
120
-
121
-
122
-
123
-
124
-
125
-
126
-
127
-
128
-
129
-
130
-
131
-
132
-
133
-
134
-
135
-
136
-
137
-
138
-
139
-
140
-
141
-
142
-
143
-
144
-
145
-
146
-
147
 |
 |

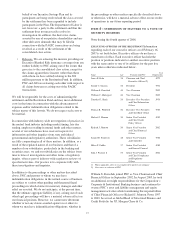
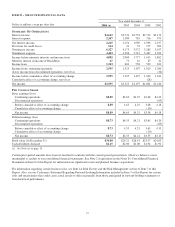
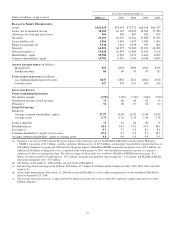
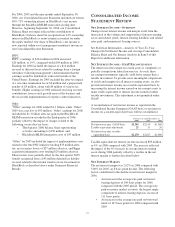
ITEM
6-
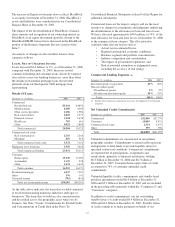
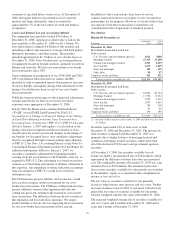
SELECTED FINANCIAL DATA
Year ended December 31
Dollars in millions, except per share data 2006 (a) 2005 2004 2003 2002
S
UMMARY
O
F
O
PERATIONS
Interest income $4,612 $3,734 $2,752 $2,712 $3,172
Interest expense 2,367 1,580 783 716 975
Net interest income 2,245 2,154 1,969 1,996 2,197
Provision for credit losses 124 21 52 177 309
Noninterest income 6,327 4,173 3,572 3,263 3,197
Noninterest expense 4,443 4,306 3,712 3,467 3,223
Income before minority interests and income taxes 4,005 2,000 1,777 1,615 1,862
Minority interest in income of BlackRock 47 71 42 47 41
Income taxes 1,363 604 538 539 621
Income from continuing operations 2,595 1,325 1,197 1,029 1,200
(Loss) income from discontinued operations, net of tax (16)
Income before cumulative effect of accounting change 2,595 1,325 1,197 1,029 1,184
Cumulative effect of accounting change, net of tax (28)
Net income $2,595 $1,325 $1,197 $1,001 $1,184
P
ER
C
OMMON
S
HARE
Basic earnings (loss)
Continuing operations $8.89 $4.63 $4.25 $3.68 $4.23
Discontinued operations (.05)
Before cumulative effect of accounting change 8.89 4.63 4.25 3.68 4.18
Cumulative effect of accounting change (.10)
Net income $8.89 $4.63 $4.25 $3.58 $4.18
Diluted earnings (loss)
Continuing operations $8.73 $4.55 $4.21 $3.65 $4.20
Discontinued operations (.05)
Before cumulative effect of accounting change 8.73 4.55 4.21 3.65 4.15
Cumulative effect of accounting change (.10)
Net income $8.73 $4.55 $4.21 $3.55 $4.15
Book value (At December 31) $36.80 $29.21 $26.41 $23.97 $24.03
Cash dividends declared $2.15 $2.00 $2.00 $1.94 $1.92
(a) See Note (a) on page 19.
Certain prior-period amounts have been reclassified to conform with the current period presentation, which we believe is more
meaningful to readers of our consolidated financial statements. See Note 2 Acquisitions in the Notes To Consolidated Financial
Statements in Item 8 of this Report for information on significant recent and planned business acquisitions.
For information regarding certain business risks, see Item 1A Risk Factors and the Risk Management section of Item 7 of this
Report. Also, see our Cautionary Statement Regarding Forward-Looking Information included in Item 7 of this Report for certain
risks and uncertainties that could cause actual results to differ materially from those anticipated in forward-looking statements or
from historical performance.
18