PNC Bank 2006 Annual Report Download - page 69
Download and view the complete annual report
Please find page 69 of the 2006 PNC Bank annual report below. You can navigate through the pages in the report by either clicking on the pages listed below, or by using the keyword search tool below to find specific information within the annual report.-
 1
1 -
2
-
3
-
4
-
5
-
6
-
7
-
8
-
9
-
10
-
11
-
12
-
13
-
14
-
15
-
16
-
17
-
18
-
19
-
20
-
21
-
22
-
23
-
24
-
25
-
26
-
27
-
28
-
29
-
30
-
31
-
32
-
33
-
34
-
35
-
36
-
37
-
38
-
39
-
40
-
41
-
42
-
43
-
44
-
45
-
46
-
47
-
48
-
49
-
50
-
51
-
52
-
53
-
54
-
55
-
56
-
57
-
58
-
 59
59 -
 60
60 -
 61
61 -
 62
62 -
 63
63 -
 64
64 -
 65
65 -
 66
66 -
 67
67 -
 68
68 -
 69
69 -
 70
70 -
 71
71 -
 72
72 -
 73
73 -
 74
74 -
 75
75 -
 76
76 -
 77
77 -
 78
78 -
 79
79 -
80
-
81
-
82
-
83
-
84
-
85
-
86
-
87
-
88
-
89
-
90
-
91
-
92
-
93
-
94
-
95
-
96
-
97
-
98
-
99
-
100
-
101
-
102
-
103
-
104
-
105
-
106
-
107
-
108
-
109
-
110
-
111
-
112
-
113
-
114
-
115
-
116
-
117
-
118
-
119
-
120
-
121
-
122
-
123
-
124
-
125
-
126
-
127
-
128
-
129
-
130
-
131
-
132
-
133
-
134
-
135
-
136
-
137
-
138
-
139
-
140
-
141
-
142
-
143
-
144
-
145
-
146
-
147
 |
 |

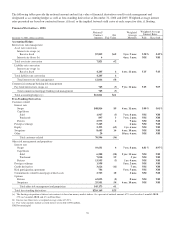
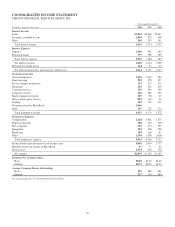
Financial Derivatives - 2005
December 31, 2005 - dollars in millions
Notional/
Contract
Amount
Net
Fair Value
Weighted
Average
Maturity
Weighted-Average
Interest Rates
Paid Received
Accounting Hedges
Interest rate risk management
Asset rate conversion
Interest rate swaps (a)
Receive fixed $2,926 $(9) 2 yrs. 10 mos. 4.75% 4.42%
Pay fixed 12 2 yrs. 1 mo. 3.68 4.77
Futures contracts 42 1 yr. 1 mo. NM NM
Total asset rate conversion 2,980 (9)
Liability rate conversion
Interest rate swaps (a)
Receive fixed 5,345 84 6 yrs. 5 mos. 4.87 5.37
Total liability rate conversion 5,345 84
Total interest rate risk management 8,325 75
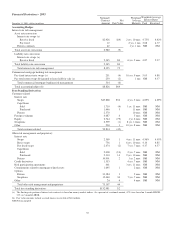
Commercial mortgage banking risk management
Pay fixed interest rate swaps (a) 251 (4) 10 yrs. 9 mos. 5.05 4.88
Pay total return swaps designated to loans held for sale (a) 250 (2) 1 mo. NM 4.37
Total commercial mortgage banking risk management 501 (6)
Total accounting hedges (b) $8,826 $69
Free-Standing Derivatives
Customer-related
Interest rate
Swaps $43,868 $34 4 yrs. 2 mos. 4.69% 4.69%
Caps/floors
Sold 1,710 (4) 1 yr. 11 mos. NM NM
Purchased 1,446 3 11 mos. NM NM
Futures 2,570 10 mos. NM NM
Foreign exchange 4,687 4 5 mos. NM NM
Equity 2,744 (79) 1 yr. 6 mos. NM NM
Swaptions 2,559 (1) 8 yrs. 11mos. NM NM
Other 230 1 10 yrs. 8 mos. NM NM
Total customer-related 59,814 (42)
Other risk management and proprietary
Interest rate
Swaps 2,369 1 4 yrs. 11 mos. 4.56% 4.65%
Basis swaps 756 1 6 yrs. 10 mos. 4.14 4.85
Pay fixed swaps 2,474 (2) 7 yrs. 7 mos. 4.37 4.57
Caps/floors
Sold 2,000 (10) 2 yrs. 7 mos. NM NM
Purchased 2,310 14 2 yrs. 10 mos. NM NM
Futures 10,901 2 1 yr. 2 mos. NM NM
Credit derivatives 1,353 4 yrs. 7 mos. NM NM
Risk participation agreements 461 3 yrs. 11 mos. NM NM
Commitments related to mortgage-related assets 1,695 1 2 mos. NM NM
Options
Futures 33,384 3 5 mos. NM NM
Swaptions 15,440 30 7 yrs. 7 mos. NM NM
Other 24 4 4 mos. NM NM
Total other risk management and proprietary 73,167 44
Total free-standing derivatives $132,981 $2
(a) The floating rate portion of interest rate contracts is based on money-market indices. As a percent of a notional amount, 67% were based on 1-month LIBOR,
33% on 3-month LIBOR.
(b) Fair value amounts include accrued interest receivable of $81 million.
NM Not meaningful
59