PNC Bank 2006 Annual Report Download - page 34
Download and view the complete annual report
Please find page 34 of the 2006 PNC Bank annual report below. You can navigate through the pages in the report by either clicking on the pages listed below, or by using the keyword search tool below to find specific information within the annual report.-
 1
1 -
2
-
3
-
4
-
5
-
6
-
7
-
8
-
9
-
10
-
11
-
12
-
13
-
14
-
15
-
16
-
17
-
18
-
19
-
20
-
21
-
22
-
23
-
 24
24 -
 25
25 -
 26
26 -
 27
27 -
 28
28 -
 29
29 -
 30
30 -
 31
31 -
 32
32 -
 33
33 -
 34
34 -
 35
35 -
 36
36 -
 37
37 -
 38
38 -
 39
39 -
 40
40 -
 41
41 -
 42
42 -
 43
43 -
 44
44 -
45
-
46
-
47
-
48
-
49
-
50
-
51
-
52
-
53
-
54
-
55
-
56
-
57
-
58
-
59
-
60
-
61
-
62
-
63
-
64
-
65
-
66
-
67
-
68
-
69
-
70
-
71
-
72
-
73
-
74
-
75
-
76
-
77
-
78
-
79
-
80
-
81
-
82
-
83
-
84
-
85
-
86
-
87
-
88
-
89
-
90
-
91
-
92
-
93
-
94
-
95
-
96
-
97
-
98
-
99
-
100
-
101
-
102
-
103
-
104
-
105
-
106
-
107
-
108
-
109
-
110
-
111
-
112
-
113
-
114
-
115
-
116
-
117
-
118
-
119
-
120
-
121
-
122
-
123
-
124
-
125
-
126
-
127
-
128
-
129
-
130
-
131
-
132
-
133
-
134
-
135
-
136
-
137
-
138
-
139
-
140
-
141
-
142
-
143
-
144
-
145
-
146
-
147
 |
 |

• By comparison, the yield on interest-earning assets
increased only 81 basis points. Loans, the single
largest component, increased 83 basis points.
• These factors were partially offset by the favorable
impact on net interest margin in 2006 of an increase
of 20 basis points related to noninterest-bearing
sources of funding.
The average federal funds rate for 2006 was 4.97% compared
with 3.21% for 2005.
We believe that net interest margins for our industry will
continue to be challenged if the yield curve remains flat or
inverted, as competition for loans and deposits remains
intense, as customers continue to migrate from lower cost to
higher cost deposits or other products and as the benefit of
adding investment securities is diminished.
From PNC’s perspective, we believe that net interest income
will increase and net interest margin will remain relatively
stable in 2007 compared with 2006. However, due to seasonal
factors in the first quarter of the year, we expect that our net
interest margin will be pressured and that our net interest
income will be relatively flat for the first quarter of 2007.
These projections are based on assumptions underlying our
most likely net interest income scenario, which may change
over time.
P
ROVISION
F
OR
C
REDIT
L
OSSES
The provision for credit losses was $124 million for 2006
compared with $21 million for 2005. The provision for credit
losses for 2005 included the benefit of a $53 million loan
recovery in the second quarter of that year resulting from a
litigation settlement. In addition to this item, the increase in
the provision for credit losses in 2006 reflected the following
factors:
• The impact of overall loan growth, as average total
loans increased $2.2 billion in 2006 compared with
the prior year;
• The effect of a single large overdraft situation that
occurred during the second quarter of 2006, and
• Growth in unfunded commitments.
We do not expect to sustain asset quality at its current level.
However, based on the assets we currently hold and current
business trends and activities, we believe that overall asset
quality will remain strong by historical standards for at least
the near term. To the extent actual outcomes differ from our
estimates, additional provision for credit losses may be
required that would reduce future earnings.
See the Credit Risk Management portion of the Risk
Management section of this Item 7 for additional information
regarding factors impacting the provision for credit losses.
N
ONINTEREST
I
NCOME
Summary
Noninterest income was $6.327 billion for 2006 and
$4.173 billion for 2005. Noninterest income for 2006 included
the impact of the gain on the BlackRock/MLIM transaction,
which totaled $2.078 billion, partially offset by the effects of
our third quarter 2006 balance sheet repositioning activities
that resulted in charges totaling $244 million.
Additional analysis
Asset management fees amounted to $1.420 billion for 2006
and $1.443 billion for 2005, a decline of $23 million. Our
equity income from BlackRock was included in asset
management fees beginning with the fourth quarter of 2006.
Asset management fees for 2005 and the first nine months of
2006 reflected the impact of BlackRock’s revenue on a
consolidated basis.
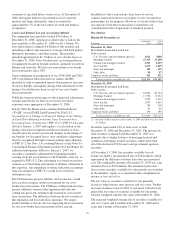
Assets managed at December 31, 2006 totaled $54 billion
compared with $494 billion at December 31, 2005 and
reflected the deconsolidation of BlackRock effective
September 29, 2006. We refer you to the Retail Banking
section of the Business Segments Review section of this
Item 7 for further discussion of Retail Banking’s assets under
management.
Fund servicing fees increased $23 million in 2006, to
$893 million, compared with $870 million in the prior year.
Included in these amounts were distribution/out-of-pocket
revenue amounts at PFPC totaling $170 million in 2006 and
$147 million in 2005, the impacts of which were offset by
expenses in the same amounts in each year.
PFPC provided fund accounting/administration services for
$837 billion of net fund assets and provided custody services
for $427 billion of fund assets at December 31, 2006,
compared with $835 billion and $476 billion, respectively, at
December 31, 2005. The decrease in custody fund assets at
December 31, 2006 compared with December 31, 2005
resulted primarily from the deconversion of a major client
during the first quarter of 2006, which was partially offset by
new business, asset inflows from existing customers, and
equity market appreciation.
Service charges on deposits increased $40 million, to
$313 million, for 2006 compared with 2005. Customer
growth, expansion of the branch network, including our
expansion into the greater Washington, DC area that began in
May 2005, and various pricing actions resulting from the One
PNC initiative all contributed to the increase in 2006.
Brokerage fees increased $21 million, to $246 million, for
2006 compared with the prior year. The increase was
primarily due to higher annuity income and mutual fund-
related revenues, including favorable production from the
fee-based fund advisory business.
24