PNC Bank 2006 Annual Report Download - page 78
Download and view the complete annual report
Please find page 78 of the 2006 PNC Bank annual report below. You can navigate through the pages in the report by either clicking on the pages listed below, or by using the keyword search tool below to find specific information within the annual report.-
 1
1 -
2
-
3
-
4
-
5
-
6
-
7
-
8
-
9
-
10
-
11
-
12
-
13
-
14
-
15
-
16
-
17
-
18
-
19
-
20
-
21
-
22
-
23
-
24
-
25
-
26
-
27
-
28
-
29
-
30
-
31
-
32
-
33
-
34
-
35
-
36
-
37
-
38
-
39
-
40
-
41
-
42
-
43
-
44
-
45
-
46
-
47
-
48
-
49
-
50
-
51
-
52
-
53
-
54
-
55
-
56
-
57
-
58
-
59
-
60
-
61
-
62
-
63
-
64
-
65
-
66
-
67
-
 68
68 -
 69
69 -
 70
70 -
 71
71 -
 72
72 -
 73
73 -
 74
74 -
 75
75 -
 76
76 -
 77
77 -
 78
78 -
 79
79 -
 80
80 -
 81
81 -
 82
82 -
 83
83 -
 84
84 -
 85
85 -
 86
86 -
 87
87 -
 88
88 -
89
-
90
-
91
-
92
-
93
-
94
-
95
-
96
-
97
-
98
-
99
-
100
-
101
-
102
-
103
-
104
-
105
-
106
-
107
-
108
-
109
-
110
-
111
-
112
-
113
-
114
-
115
-
116
-
117
-
118
-
119
-
120
-
121
-
122
-
123
-
124
-
125
-
126
-
127
-
128
-
129
-
130
-
131
-
132
-
133
-
134
-
135
-
136
-
137
-
138
-
139
-
140
-
141
-
142
-
143
-
144
-
145
-
146
-
147
 |
 |

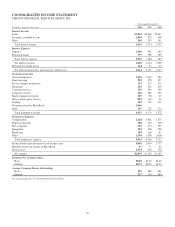
CONSOLIDATED INCOME STATEMENT
THE PNC FINANCIAL SERVICES GROUP, INC.
Year ended December 31
In millions, except per share data 2006 2005 2004
Interest Income
Loans $3,203 $2,669 $2,043
Securities available for sale 1,049 822 568
Other 360 243 141
Total interest income 4,612 3,734 2,752
Interest Expense
Deposits 1,590 981 484
Borrowed funds 777 599 299
Total interest expense 2,367 1,580 783
Net interest income 2,245 2,154 1,969
Provision for credit losses 124 21 52
Net interest income less provision for credit losses 2,121 2,133 1,917
Noninterest Income
Asset management 1,420 1,443 994
Fund servicing 893 870 817
Service charges on deposits 313 273 252
Brokerage 246 225 219
Consumer services 365 293 259
Corporate services 626 485 423
Equity management gains 107 96 67
Net securities gains (losses) (207) (41) 55
Trading 183 157 113
Net gains related to BlackRock 2,066
Other 315 372 373
Total noninterest income 6,327 4,173 3,572
Noninterest Expense
Compensation 2,128 2,061 1,755
Employee benefits 304 332 309
Net occupancy 310 313 267
Equipment 303 296 290
Marketing 104 106 87
Other 1,294 1,198 1,004
Total noninterest expense 4,443 4,306 3,712
Income before minority interest and income taxes 4,005 2,000 1,777
Minority interest in income of BlackRock 47 71 42
Income taxes 1,363 604 538
Net income $2,595 $1,325 $1,197
Earnings Per Common Share
Basic $8.89 $4.63 $4.25
Diluted $8.73 $4.55 $4.21
Average Common Shares Outstanding
Basic 292 286 281
Diluted 297 290 284
See accompanying Notes To Consolidated Financial Statements.
68