PNC Bank 2006 Annual Report Download - page 117
Download and view the complete annual report
Please find page 117 of the 2006 PNC Bank annual report below. You can navigate through the pages in the report by either clicking on the pages listed below, or by using the keyword search tool below to find specific information within the annual report.-
 1
1 -
2
-
3
-
4
-
5
-
6
-
7
-
8
-
9
-
10
-
11
-
12
-
13
-
14
-
15
-
16
-
17
-
18
-
19
-
20
-
21
-
22
-
23
-
24
-
25
-
26
-
27
-
28
-
29
-
30
-
31
-
32
-
33
-
34
-
35
-
36
-
37
-
38
-
39
-
40
-
41
-
42
-
43
-
44
-
45
-
46
-
47
-
48
-
49
-
50
-
51
-
52
-
53
-
54
-
55
-
56
-
57
-
58
-
59
-
60
-
61
-
62
-
63
-
64
-
65
-
66
-
67
-
68
-
69
-
70
-
71
-
72
-
73
-
74
-
75
-
76
-
77
-
78
-
79
-
80
-
81
-
82
-
83
-
84
-
85
-
86
-
87
-
88
-
89
-
90
-
91
-
92
-
93
-
94
-
95
-
96
-
97
-
98
-
99
-
100
-
101
-
102
-
103
-
104
-
105
-
106
-
 107
107 -
 108
108 -
 109
109 -
 110
110 -
 111
111 -
 112
112 -
 113
113 -
 114
114 -
 115
115 -
 116
116 -
 117
117 -
 118
118 -
 119
119 -
 120
120 -
 121
121 -
 122
122 -
 123
123 -
 124
124 -
 125
125 -
 126
126 -
 127
127 -
128
-
129
-
130
-
131
-
132
-
133
-
134
-
135
-
136
-
137
-
138
-
139
-
140
-
141
-
142
-
143
-
144
-
145
-
146
-
147
 |
 |

E
MPLOYEE
S
TOCK
P
URCHASE
P
LAN
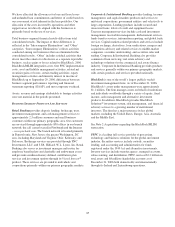
Our ESPP has approximately 1.4 million shares available for
issuance. Full-time employees with six months and part-time
employees with 12 months of continuous employment with us
are eligible to participate in the ESPP at the commencement of
the next six-month offering period. Eligible participants may
purchase our common stock at 95% of the fair market value
on the last day of each six-month offering period. No charge
to earnings is recorded with respect to the ESPP.
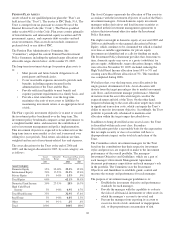
Shares issued pursuant to the ESPP were as follows:
Year ended December 31 Shares Price Per Share
2006 105,041 $66.66 and $70.34
2005 138,754 51.74 and 58.74
2004 156,753 50.43 and 54.57
B
LACK
R
OCK
LTIP P
ROGRAMS
BlackRock adopted the 2002 LTIP program to help attract and
retain qualified professionals. At that time, we agreed to
transfer 4 million of the shares of BlackRock common stock
then held by us to fund the 2002 and future programs
approved by BlackRock’s board of directors, subject to certain
conditions and limitations. Prior to 2006, BlackRock granted
awards under the 2002 LTIP program of approximately $230
million, of which approximately $210 million was paid on
January 30, 2007. The awards were paid approximately 17%
in cash by BlackRock and the remainder in BlackRock
common stock transferred by us to the LTIP participants
(approximately 1 million shares). As permitted under the
award agreements, employees elected to put approximately
95% of the stock portion of the awards back to BlackRock.
These shares were retained by BlackRock as treasury stock.
BlackRock granted additional restricted stock unit awards in
January 2007, all of which are subject to achieving earnings
performance goals prior to the vesting date of September 29,
2011. Of the shares of BlackRock common stock that we have
agreed to transfer to fund their LTIP programs, approximately
1.6 million shares have been committed to fund the restricted
stock unit awards vesting in 2011 and the amount remaining
would then be available for future awards.
We reported noninterest expense of $33 million, $64 million
and $110 million for the years ended December 31, 2006,
2005 and 2004, respectively, related to the BlackRock LTIP
awards. Additionally, noninterest income in the fourth quarter
of 2006 included a $12 million charge related to our
commitment to fund the BlackRock LTIP programs. This
charge represents the mark-to-market of our BlackRock LTIP
obligation as of December 31, 2006 and is a result of the
fourth quarter increase in the market value of BlackRock
common shares.
N
OTE
19 E
ARNINGS
P
ER
S
HARE
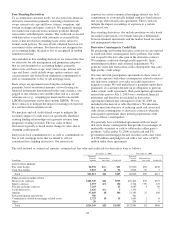
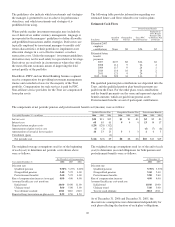
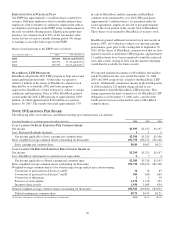
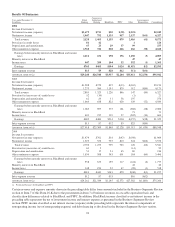
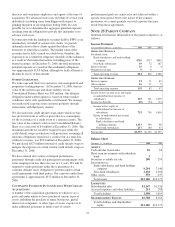
The following table sets forth basic and diluted earnings per common share calculations:
Year ended December 31 - in millions, except share and per share data 2006 2005 2004
C
ALCULATION
O
F
B
ASIC
E
ARNINGS
P
ER
C
OMMON
S
HARE
Net income $2,595 $1,325 $1,197
Less: Preferred dividends declared 111
Net income applicable to basic earnings per common share $2,594 $1,324 $1,196
Basic weighted-average common shares outstanding (in thousands) 291,758 286,276 281,248
Basic earnings per common share $8.89 $4.63 $4.25
C
ALCULATION
O
F
D
ILUTED
E
ARNINGS
P
ER
C
OMMON
S
HARE
(a)
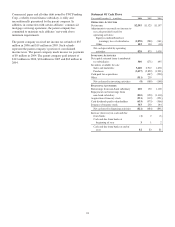
Net income $2,595 $1,325 $1,197
Less: BlackRock adjustment for common stock equivalents 674
Net income applicable to diluted earnings per common share $2,589 $1,318 $1,193
Basic weighted-average common shares outstanding (in thousands) 291,758 286,276 281,248
Weighted-average common shares to be issued using average market price and assuming:
Conversion of preferred stock Series A and B 70 78 85
Conversion of preferred stock Series C and D 584 618 663
Conversion of debentures 2210
Exercise of stock options 2,178 1,178 992
Incentive share awards 1,930 1,688 634
Diluted weighted-average common shares outstanding (in thousands) 296,522 289,840 283,632
Diluted earnings per common share $8.73 $4.55 $4.21
(a) Excludes stock options considered to be anti-dilutive (in thousands) 4,230 10,532 10,762
107