PNC Bank 2006 Annual Report Download - page 128
Download and view the complete annual report
Please find page 128 of the 2006 PNC Bank annual report below. You can navigate through the pages in the report by either clicking on the pages listed below, or by using the keyword search tool below to find specific information within the annual report.-
 1
1 -
2
-
3
-
4
-
5
-
6
-
7
-
8
-
9
-
10
-
11
-
12
-
13
-
14
-
15
-
16
-
17
-
18
-
19
-
20
-
21
-
22
-
23
-
24
-
25
-
26
-
27
-
28
-
29
-
30
-
31
-
32
-
33
-
34
-
35
-
36
-
37
-
38
-
39
-
40
-
41
-
42
-
43
-
44
-
45
-
46
-
47
-
48
-
49
-
50
-
51
-
52
-
53
-
54
-
55
-
56
-
57
-
58
-
59
-
60
-
61
-
62
-
63
-
64
-
65
-
66
-
67
-
68
-
69
-
70
-
71
-
72
-
73
-
74
-
75
-
76
-
77
-
78
-
79
-
80
-
81
-
82
-
83
-
84
-
85
-
86
-
87
-
88
-
89
-
90
-
91
-
92
-
93
-
94
-
95
-
96
-
97
-
98
-
99
-
100
-
101
-
102
-
103
-
104
-
105
-
106
-
107
-
108
-
109
-
110
-
111
-
112
-
113
-
114
-
115
-
116
-
117
-
 118
118 -
 119
119 -
 120
120 -
 121
121 -
 122
122 -
 123
123 -
 124
124 -
 125
125 -
 126
126 -
 127
127 -
 128
128 -
 129
129 -
 130
130 -
 131
131 -
 132
132 -
 133
133 -
 134
134 -
 135
135 -
 136
136 -
 137
137 -
 138
138 -
139
-
140
-
141
-
142
-
143
-
144
-
145
-
146
-
147
 |
 |

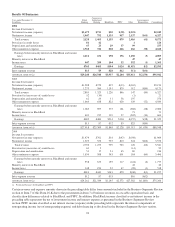
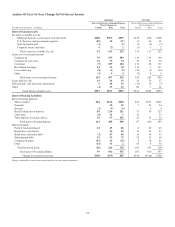
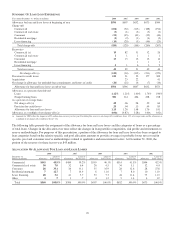
Analysis Of Year-To-Year Changes In Net Interest Income
2006/2005 2005/2004
Increase/(Decrease) in Income/Expense
Due to Changes in:
Increase/(Decrease) in Income/Expense
Due to Changes in:
Taxable-equivalent basis - in millions Volume Rate Total Volume Rate Total
Interest-Earning Assets
Securities available for sale
Mortgage-backed, asset-backed, and other debt $188 $107 $295 $130 $66 $196
U.S. Treasury and government agencies (85) 14 (71) 11 50 61
State and municipal (1) (1) (3) (4) (7)
Corporate stocks and other 4 (2) 2 (3) 5 2
Total securities available for sale 92 133 225 135 117 252
Loans, net of unearned income
Commercial 76 233 309 130 174 304
Commercial real estate 41 33 74 25 31 56
Consumer (5) 109 104 111 66 177
Residential mortgage 41 13 54 110 1 111
Lease financing (8) (1) (9) (23) (1) (24)
Other (5) 9 4 (2) 8 6
Total loans, net of unearned income 129 407 536 345 285 630
Loans held for sale 19 34 53 24 33 57
Federal funds sold and resale agreements 52833 (15) 10 (5)
Other (4) 27 23 60 1 61
Total interest-earning assets $253 $617 $870 $541 $454 $995
Interest-Bearing Liabilities
Interest-bearing deposits
Money market $44 $216 $260 $21 $231 $252
Demand 32 32 12324
Savings (3) (3) (6) 55
Retail certificates of deposit 85 126 211 77 50 127
Other time (8) 15 7 33 33
Time deposits in foreign offices 52 53 105 21 35 56
Total interest-bearing deposits 111 498 609 97 400 497
Borrowed funds
Federal funds purchased 41 45 86 24345
Repurchase agreements 36 36 13 34 47
Bank notes and senior debt (2) 47 45 14 39 53
Subordinated debt 19 53 72 23 35 58
Commercial paper (87) 24 (63) 63844
Other (14) 16 2 45 8 53
Total borrowed funds (46) 224 178 105 195 300
Total interest-bearing liabilities 95 692 787 187 610 797
Change in net interest income $138 $(55) $83 $342 $(144) $198
Changes attributable to rate/volume are prorated into rate and volume components.
118