PNC Bank 2006 Annual Report Download - page 116
Download and view the complete annual report
Please find page 116 of the 2006 PNC Bank annual report below. You can navigate through the pages in the report by either clicking on the pages listed below, or by using the keyword search tool below to find specific information within the annual report.-
 1
1 -
2
-
3
-
4
-
5
-
6
-
7
-
8
-
9
-
10
-
11
-
12
-
13
-
14
-
15
-
16
-
17
-
18
-
19
-
20
-
21
-
22
-
23
-
24
-
25
-
26
-
27
-
28
-
29
-
30
-
31
-
32
-
33
-
34
-
35
-
36
-
37
-
38
-
39
-
40
-
41
-
42
-
43
-
44
-
45
-
46
-
47
-
48
-
49
-
50
-
51
-
52
-
53
-
54
-
55
-
56
-
57
-
58
-
59
-
60
-
61
-
62
-
63
-
64
-
65
-
66
-
67
-
68
-
69
-
70
-
71
-
72
-
73
-
74
-
75
-
76
-
77
-
78
-
79
-
80
-
81
-
82
-
83
-
84
-
85
-
86
-
87
-
88
-
89
-
90
-
91
-
92
-
93
-
94
-
95
-
96
-
97
-
98
-
99
-
100
-
101
-
102
-
103
-
104
-
105
-
 106
106 -
 107
107 -
 108
108 -
 109
109 -
 110
110 -
 111
111 -
 112
112 -
 113
113 -
 114
114 -
 115
115 -
 116
116 -
 117
117 -
 118
118 -
 119
119 -
 120
120 -
 121
121 -
 122
122 -
 123
123 -
 124
124 -
 125
125 -
 126
126 -
127
-
128
-
129
-
130
-
131
-
132
-
133
-
134
-
135
-
136
-
137
-
138
-
139
-
140
-
141
-
142
-
143
-
144
-
145
-
146
-
147
 |
 |

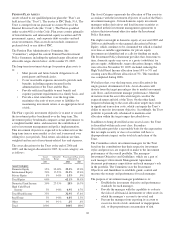
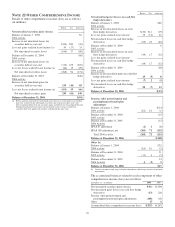
There were no options granted in excess of market value in
2006, 2005 or 2004. Shares of common stock available during
the next year for the granting of options and other awards
under the Incentive Plans were 42,767,760 at December 31,
2006.
During 2006, we issued approximately 4.9 million shares from
treasury stock in connection with stock option exercise
activity. As with past exercise activity, we intend to utilize
treasury stock for future stock option exercises.
As discussed in Note 1 Accounting Policies, we adopted the
fair value recognition provisions of SFAS 123 prospectively
to all employee awards including stock options granted,
modified or settled after January 1, 2003. As permitted under
SFAS 123, we recognized compensation expense for stock
options on a straight-line basis over the pro rata vesting
period. Total compensation expense recognized related to
PNC stock options in 2006 was $31 million compared with
$29 million in 2005 and $21 million in 2004.
P
RO
F
ORMA
E
FFECTS
A table is included in Note 1 Accounting Policies that sets
forth pro forma net income and basic and diluted earnings per
share as if compensation expense had been recognized under
SFAS 123 and 123R, as amended, for stock options for 2006,
2005 and 2004.
For purposes of computing stock option expense and pro
forma results, we estimated the fair value of stock options
using the Black-Scholes option pricing model. The model
requires the use of numerous assumptions, many of which are
very subjective. Therefore, the pro forma results are estimates
of results of operations as if compensation expense had been
recognized for all stock-based compensation awards and are
not indicative of the impact on future periods.
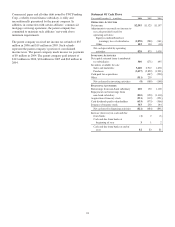
We used the following assumptions in the option pricing
model for purposes of estimating pro forma results as well as
to determine actual stock option expense:
• The risk-free interest rate is based on the US
Treasury yield curve,
• The dividend yield represents average yields over the
previous three-year period,
• Volatility is measured using the fluctuation in
month-end closing stock prices over a five-year
period, and
• The expected life assumption represents the period of
time that options granted are expected to be
outstanding and is based on a weighted-average of
historical option activity.
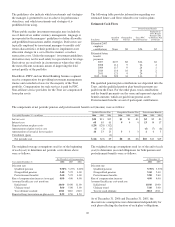
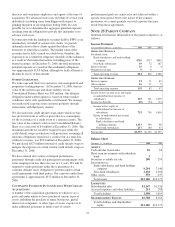
Option Pricing Assumptions
Weighted-average for the year
ended December 31 2006 2005 2004
Risk-free interest rate 4.5% 3.8% 3.4%
Dividend yield 3.7 3.8 3.6
Volatility 20.5 25.7 28.9
Expected life 5.1 yrs. 4.8 yrs. 4.9 yrs.
I
NCENTIVE
/P
ERFORMANCE
U
NIT
S
HARE AND
R
ESTRICTED
S
TOCK
A
WARDS
The fair value of nonvested incentive/performance unit shares
and restricted stock awards is initially determined based on the
average of the high and low of our common stock price on the
date of grant. Incentive/performance unit shares are
subsequently valued subject to the achievement of one or
more financial and other performance goals over a three-year
period. The Personnel and Compensation Committee of the
Board of Directors approves the final award of incentive/
performance unit shares. Restricted stock awards have various
vesting periods ranging from 36 months to 60 months. There
are no financial or performance goals associated with any of
our restricted stock awards.
The weighted-average grant-date fair value of incentive share
and restricted stock awards granted in 2006, 2005 and 2004
was $67.36, $53.81 and $54.46 per share, respectively. We
recognize compensation expense for incentive/performance
unit shares and restricted stock awards ratably over the
corresponding vesting and/or performance periods for each
type of program. Total compensation expense recognized
related to PNC incentive/performance unit share and restricted
stock awards during 2006 was approximately $45 million
compared with $44 million in 2005 and $25 million in 2004.
A summary of nonvested incentive/performance unit shares
and restricted stock award activity follows:
Shares in thousands
Nonvested
Incentive/
Performance
Unit Shares
Weighted-
Average
Grant
Date Fair
Value
Nonvested
Restricted
Shares
Weighted-
Average
Grant
Date Fair
Value
Dec. 31, 2005 660 $41.01 2,209 $50.84
Granted 186 69.58 595 64.19
Awarded as restricted (649) 41.02 649 66.95
Vested (917) 53.14
Forfeited (11) 40.51 (111) 53.06
Dec. 31, 2006 186 $69.58 2,425 $57.45
At December 31, 2006, there was $47 million of unrecognized
deferred compensation expense related to nonvested share-
based compensation arrangements granted under the Incentive
Plans. This cost is expected to be recognized as expense over a
period of no longer than five years. The total fair value of
incentive/performance unit share and restricted stock awards
vested during 2006, 2005 and 2004 was approximately $63
million, $3 million and $5 million, respectively.
Additionally in 2006, we granted a performance unit incentive
award to a certain senior executive. The grant is share-
denominated with an initial specified target number of 30,000
share units. The potential award is dependent on the
achievement of certain performance criteria over a three-year
period ending December 31, 2008. Final awarded performance
units will be paid only in cash. Total compensation expense
recognized related to this incentive award during 2006 was
approximately $1 million.
106