PNC Bank 2006 Annual Report Download - page 29
Download and view the complete annual report
Please find page 29 of the 2006 PNC Bank annual report below. You can navigate through the pages in the report by either clicking on the pages listed below, or by using the keyword search tool below to find specific information within the annual report.-
 1
1 -
2
-
3
-
4
-
5
-
6
-
7
-
8
-
9
-
10
-
11
-
12
-
13
-
14
-
15
-
16
-
17
-
18
-
 19
19 -
 20
20 -
 21
21 -
 22
22 -
 23
23 -
 24
24 -
 25
25 -
 26
26 -
 27
27 -
 28
28 -
 29
29 -
 30
30 -
 31
31 -
 32
32 -
 33
33 -
 34
34 -
 35
35 -
 36
36 -
 37
37 -
 38
38 -
 39
39 -
40
-
41
-
42
-
43
-
44
-
45
-
46
-
47
-
48
-
49
-
50
-
51
-
52
-
53
-
54
-
55
-
56
-
57
-
58
-
59
-
60
-
61
-
62
-
63
-
64
-
65
-
66
-
67
-
68
-
69
-
70
-
71
-
72
-
73
-
74
-
75
-
76
-
77
-
78
-
79
-
80
-
81
-
82
-
83
-
84
-
85
-
86
-
87
-
88
-
89
-
90
-
91
-
92
-
93
-
94
-
95
-
96
-
97
-
98
-
99
-
100
-
101
-
102
-
103
-
104
-
105
-
106
-
107
-
108
-
109
-
110
-
111
-
112
-
113
-
114
-
115
-
116
-
117
-
118
-
119
-
120
-
121
-
122
-
123
-
124
-
125
-
126
-
127
-
128
-
129
-
130
-
131
-
132
-
133
-
134
-
135
-
136
-
137
-
138
-
139
-
140
-
141
-
142
-
143
-
144
-
145
-
146
-
147
 |
 |

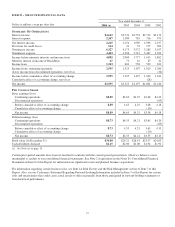
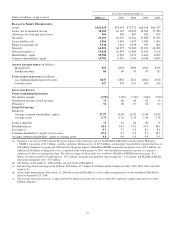
At or year ended December 31
Dollars in millions, except as noted 2006 (a) 2005 2004 2003 2002
B
ALANCE
S
HEET
H
IGHLIGHTS
Assets $101,820 $91,954 $79,723 $68,168 $66,377
Loans, net of unearned income 50,105 49,101 43,495 36,303 35,450
Allowance for loan and lease losses 560 596 607 632 673
Securities 23,191 20,710 16,761 15,690 13,763
Loans held for sale 2,366 2,449 1,670 1,400 1,607
Equity investments (b) 5,330 1,323 1,058 997 862
Deposits 66,301 60,275 53,269 45,241 44,982
Borrowed funds (c) 15,028 16,897 11,964 11,453 9,116
Shareholders’ equity 10,788 8,563 7,473 6,645 6,859
Common shareholders’ equity 10,781 8,555 7,465 6,636 6,849
A
SSETS
A
DMINISTERED
(in billions)
Managed (d) $54 $494 $383 $354 $313
Nondiscretionary 86 84 93 87 82
F
UND ASSETS SERVICED
(in billions)
Accounting/administration net assets $837 $835 $721 $654 $510
Custody assets 427 476 451 401 336
S
ELECTED
R
ATIOS
From Continuing Operations
Net interest margin 2.92% 3.00% 3.22% 3.64% 3.99%
Noninterest income to total revenue 74 66 64 62 59
Efficiency 52 68 67 66 60
From Net Income
Return on
Average common shareholders’ equity 27.97 16.58 16.82 15.06 18.83
Average assets 2.73 1.50 1.59 1.49 1.78
Loans to deposits 76 81 82 80 79
Dividend payout 24.4 43.4 47.2 54.5 46.1
Leverage (e) 9.3 7.2 7.6 8.2 8.1
Common shareholders’ equity to total assets 10.6 9.3 9.4 9.7 10.3
Average common shareholders’ equity to average assets 9.8 9.0 9.4 9.9 9.4
(a) Noninterest income for 2006 included the pretax impact of the following: gain on the BlackRock/Merrill Lynch Investment Managers
(“MLIM”) transaction of $2.1 billion; securities portfolio rebalancing loss of $196 million; and mortgage loan portfolio repositioning loss of
$48 million. Noninterest expense for 2006 included the pretax impact of BlackRock/MLIM transaction integration costs of $91 million. An
additional $10 million of integration costs, recognized in the fourth quarter of 2006, were included in noninterest income as a negative
component of the asset management line. The after-tax impact of these items was as follows: BlackRock/MLIM transaction gain - $1.3
billion; securities portfolio rebalancing loss - $127 million; mortgage loan portfolio repositioning loss - $31 million; and BlackRock/MLIM
transaction integration costs - $47 million.
(b) The balance at December 31, 2006 includes our investment in BlackRock.
(c) Includes long-term borrowings of $6.6 billion, $6.8 billion, $5.7 billion, $5.8 billion and $6.0 billion for 2006, 2005, 2004, 2003 and 2002,
respectively.
(d) Assets under management at December 31, 2006 do not include BlackRock’s assets under management as we deconsolidated BlackRock
effective September 29, 2006.
(e) The leverage ratio represents tier 1 capital divided by adjusted average total assets as defined by regulatory capital requirements for bank
holding companies.
19