PNC Bank 2006 Annual Report Download - page 100
Download and view the complete annual report
Please find page 100 of the 2006 PNC Bank annual report below. You can navigate through the pages in the report by either clicking on the pages listed below, or by using the keyword search tool below to find specific information within the annual report.-
 1
1 -
2
-
3
-
4
-
5
-
6
-
7
-
8
-
9
-
10
-
11
-
12
-
13
-
14
-
15
-
16
-
17
-
18
-
19
-
20
-
21
-
22
-
23
-
24
-
25
-
26
-
27
-
28
-
29
-
30
-
31
-
32
-
33
-
34
-
35
-
36
-
37
-
38
-
39
-
40
-
41
-
42
-
43
-
44
-
45
-
46
-
47
-
48
-
49
-
50
-
51
-
52
-
53
-
54
-
55
-
56
-
57
-
58
-
59
-
60
-
61
-
62
-
63
-
64
-
65
-
66
-
67
-
68
-
69
-
70
-
71
-
72
-
73
-
74
-
75
-
76
-
77
-
78
-
79
-
80
-
81
-
82
-
83
-
84
-
85
-
86
-
87
-
88
-
89
-
 90
90 -
 91
91 -
 92
92 -
 93
93 -
 94
94 -
 95
95 -
 96
96 -
 97
97 -
 98
98 -
 99
99 -
 100
100 -
 101
101 -
 102
102 -
 103
103 -
 104
104 -
 105
105 -
 106
106 -
 107
107 -
 108
108 -
 109
109 -
 110
110 -
111
-
112
-
113
-
114
-
115
-
116
-
117
-
118
-
119
-
120
-
121
-
122
-
123
-
124
-
125
-
126
-
127
-
128
-
129
-
130
-
131
-
132
-
133
-
134
-
135
-
136
-
137
-
138
-
139
-
140
-
141
-
142
-
143
-
144
-
145
-
146
-
147
 |
 |

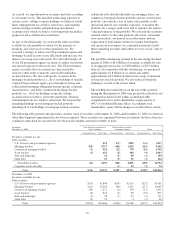
As a result, we repositioned our securities portfolio according
to our market views. This included reallocating exposure to
certain sectors, selling securities holdings we believed would
likely underperform on a relative value basis, and retaining
certain existing securities and purchasing incremental
securities all of which we believe will outperform the market
going forward as further discussed below.
As part of the rebalancing, we assessed the entire securities
available for sale portfolio of which, for the majority of
positions, fair value was less than amortized cost. We
executed a strategy to reduce our US government agency and
mortgage-backed security sector allocations and increase our
interest rate swap sector allocation. We sold substantially all
of our US government agency securities to reduce our interest
rate spread exposure to that asset class. The US government
agency securities that we retained are characterized by
relatively short terms to maturity and smaller individual
security balances. We also sold specific securities in the
mortgage-backed portfolio (i.e., all of our holdings of specific
coupon US government agency pass-through securities and
collateralized mortgage obligations having specific collateral
characteristics), and in the commercial mortgage-backed
portfolio (i.e., all of our holdings of specific vintage
securities) that we believe, given the underlying collateral,
will underperform on a relative value basis. We retained the
remaining holdings in our mortgage-backed portfolio
including all of our holdings of mortgage-backed securities
collateralized by hybrid adjustable rate mortgage loans, our
commercial mortgage-backed portfolio and our asset-backed
portfolio. Our objective was to reduce the portfolio credit
spread and interest rate volatility exposures, to position the
portfolio for a steeper yield curve and to optimize the relative
value performance of the portfolio. We assessed the securities
retained relative to the same portfolio objectives, our market
view and outlook, our desired sector allocations and our
expectation of performance relative to market benchmarks,
and, given our assessment, we confirmed our intent to hold
these remaining securities until either recovery of fair value or
maturity.
The portfolio rebalancing resulted in the sale during the third
quarter of 2006 of $6.0 billion of securities available for sale
at an aggregate pretax loss of $196 million, or $127 million
after-tax. In connection with this rebalancing, we purchased
approximately $1.8 billion of securities and added
approximately $4.0 billion of interest rate swaps to maintain
our interest rate risk position. We also reduced wholesale
funding as a result of the actions taken.
The resulting net realized losses on the sale of the securities
during the third quarter of 2006 were previously reflected as net
unrealized securities losses within accumulated other
comprehensive loss in the shareholders’ equity section of
PNC’s Consolidated Balance Sheet. Accordingly, total
shareholders’ equity did not change as a result of these actions.
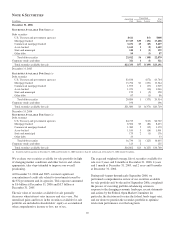
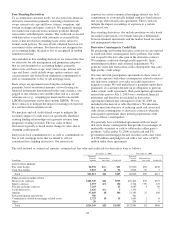
The following table presents unrealized loss and fair value of securities at December 31, 2006 and December 31, 2005 for which an
other-than-temporary impairment has not been recognized. These securities are segregated between investments that have been in a
continuous unrealized loss position for less than twelve months and twelve months or more.
In millions
December 31, 2006
Unrealized loss position less
than 12 months
Unrealized loss position
12 months or more Total
Unrealized Loss Fair Value Unrealized Loss Fair Value Unrealized Loss Fair Value
Securities available for sale
Debt securities
U.S. Treasury and government agencies $15 $(3) $302 $(3) $317
Mortgage-backed $(8) 2,717 (148) 6,925 (156) 9,642
Commercial mortgage-backed (3) 924 (22) 778 (25) 1,702
Asset-backed (1) 414 (8) 649 (9) 1,063
State and municipal 16 (2) 88 (2) 104
Other debt 65 (3) 59 (3) 124
Total debt securities (12) 4,151 (186) 8,801 (198) 12,952
Corporate stocks and other (1) 10 (1) 10
Total $(12) $4,151 $(187) $8,811 $(199) $12,962
December 31, 2005
Securities available for sale
Debt securities
U.S. Treasury and government agencies $(33) $1,898 $(39) $1,553 $(72) $3,451
Mortgage-backed (161) 10,544 (90) 2,321 (251) 12,865
Commercial mortgage-backed (29) 1,272 (8) 339 (37) 1,611
Asset-backed (8) 835 (2) 98 (10) 933
State and municipal (1) 58 (1) 53 (2) 111
Other debt (1) 59 4 (1) 63
Total $(233) $14,666 $(140) $4,368 $(373) $19,034
90