PNC Bank 2006 Annual Report Download - page 132
Download and view the complete annual report
Please find page 132 of the 2006 PNC Bank annual report below. You can navigate through the pages in the report by either clicking on the pages listed below, or by using the keyword search tool below to find specific information within the annual report.-
 1
1 -
2
-
3
-
4
-
5
-
6
-
7
-
8
-
9
-
10
-
11
-
12
-
13
-
14
-
15
-
16
-
17
-
18
-
19
-
20
-
21
-
22
-
23
-
24
-
25
-
26
-
27
-
28
-
29
-
30
-
31
-
32
-
33
-
34
-
35
-
36
-
37
-
38
-
39
-
40
-
41
-
42
-
43
-
44
-
45
-
46
-
47
-
48
-
49
-
50
-
51
-
52
-
53
-
54
-
55
-
56
-
57
-
58
-
59
-
60
-
61
-
62
-
63
-
64
-
65
-
66
-
67
-
68
-
69
-
70
-
71
-
72
-
73
-
74
-
75
-
76
-
77
-
78
-
79
-
80
-
81
-
82
-
83
-
84
-
85
-
86
-
87
-
88
-
89
-
90
-
91
-
92
-
93
-
94
-
95
-
96
-
97
-
98
-
99
-
100
-
101
-
102
-
103
-
104
-
105
-
106
-
107
-
108
-
109
-
110
-
111
-
112
-
113
-
114
-
115
-
116
-
117
-
118
-
119
-
120
-
121
-
 122
122 -
 123
123 -
 124
124 -
 125
125 -
 126
126 -
 127
127 -
 128
128 -
 129
129 -
 130
130 -
 131
131 -
 132
132 -
 133
133 -
 134
134 -
 135
135 -
 136
136 -
 137
137 -
 138
138 -
 139
139 -
 140
140 -
 141
141 -
 142
142 -
143
-
144
-
145
-
146
-
147
 |
 |

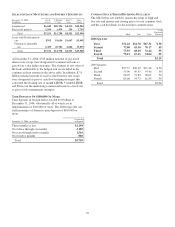
S
ELECTED
L
OAN
M
ATURITIES AND
I
NTEREST
S
ENSITIVITY
December 31, 2006
In millions
1 Year
or Less
1 Through
5 Years
After 5
Years
Gross
Loans
Commercial $6,045 $10,324 $4,215 $20,584
Real estate projects 1,106 1,474 136 2,716
Total $7,151 $11,798 $4,351 $23,300
Loans with Predetermined
rate $762 $1,016 $1,667 $3,445
Floating or adjustable
rate 6,389 10,782 2,684 19,855
Total $7,151 $11,798 $4,351 $23,300
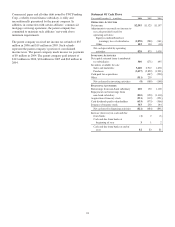
At December 31, 2006, $745 million notional of pay-fixed
interest rate swaps were designated to commercial loans as
part of fair value hedge strategies. The changes in fair value of
the loans attributable to the hedged risk are included in the
commercial loan amount in the above table. In addition, $7.8
billion notional amount of receive-fixed interest rate swaps
were designated as part of cash flow hedging strategies that
converted the floating rate (1 month LIBOR, 3 month LIBOR
and Prime) on the underlying commercial loans to a fixed rate
as part of risk management strategies.
T
IME
D
EPOSITS
O
F
$100,000 O
R
M
ORE
Time deposits in foreign offices totaled $3.0 billion at
December 31, 2006, substantially all of which are in
denominations of $100,000 or more. The following table sets
forth maturities of domestic time deposits of $100,000 or
more:
December 31, 2006 – in millions
Certificates
of Deposit
Three months or less $1,169
Over three through six months 2,185
Over six through twelve months 1,516
Over twelve months 880
Total $5,750
C
OMMON
S
TOCK
P
RICES
/D
IVIDENDS
D
ECLARED
The table below sets forth by quarter the range of high and
low sale and quarter-end closing prices for our common stock
and the cash dividends we declared per common share.
High Low Close
Cash
Dividends
Declared
2006 Quarter
First $71.42 $61.78 $67.31 $.50
Second 72.00 65.30 70.17 .55
Third 73.55 68.09 72.44 .55
Fourth 75.15 67.61 74.04 .55
Total $2.15
2005 Quarter
First $57.57 $50.30 $51.48 $.50
Second 55.90 49.35 54.46 .50
Third 58.95 53.80 58.02 .50
Fourth 65.66 54.73 61.83 .50
Total $2.00
122