PNC Bank 2006 Annual Report Download - page 102
Download and view the complete annual report
Please find page 102 of the 2006 PNC Bank annual report below. You can navigate through the pages in the report by either clicking on the pages listed below, or by using the keyword search tool below to find specific information within the annual report.-
 1
1 -
2
-
3
-
4
-
5
-
6
-
7
-
8
-
9
-
10
-
11
-
12
-
13
-
14
-
15
-
16
-
17
-
18
-
19
-
20
-
21
-
22
-
23
-
24
-
25
-
26
-
27
-
28
-
29
-
30
-
31
-
32
-
33
-
34
-
35
-
36
-
37
-
38
-
39
-
40
-
41
-
42
-
43
-
44
-
45
-
46
-
47
-
48
-
49
-
50
-
51
-
52
-
53
-
54
-
55
-
56
-
57
-
58
-
59
-
60
-
61
-
62
-
63
-
64
-
65
-
66
-
67
-
68
-
69
-
70
-
71
-
72
-
73
-
74
-
75
-
76
-
77
-
78
-
79
-
80
-
81
-
82
-
83
-
84
-
85
-
86
-
87
-
88
-
89
-
90
-
91
-
 92
92 -
 93
93 -
 94
94 -
 95
95 -
 96
96 -
 97
97 -
 98
98 -
 99
99 -
 100
100 -
 101
101 -
 102
102 -
 103
103 -
 104
104 -
 105
105 -
 106
106 -
 107
107 -
 108
108 -
 109
109 -
 110
110 -
 111
111 -
 112
112 -
113
-
114
-
115
-
116
-
117
-
118
-
119
-
120
-
121
-
122
-
123
-
124
-
125
-
126
-
127
-
128
-
129
-
130
-
131
-
132
-
133
-
134
-
135
-
136
-
137
-
138
-
139
-
140
-
141
-
142
-
143
-
144
-
145
-
146
-
147
 |
 |

N
OTE
7L
OANS
,C
OMMITMENTS
T
O
E
XTEND
C
REDIT AND
C
ONCENTRATIONS OF
C
REDIT
R
ISK
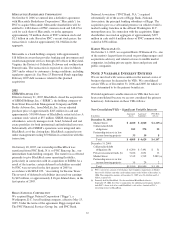
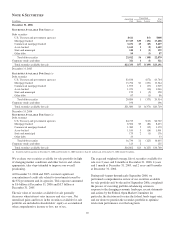
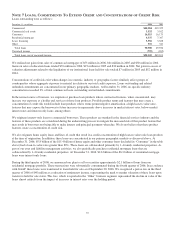
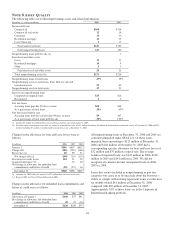
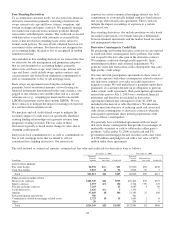
Loans outstanding were as follows:
December 31 - in millions 2006 2005
Commercial $20,584 $19,325
Commercial real estate 3,532 3,162
Consumer 16,515 16,173
Residential mortgage 6,337 7,307
Lease financing 3,556 3,628
Other 376 341
Total loans 50,900 49,936
Unearned income (795) (835)
Total loans, net of unearned income $50,105 $49,101
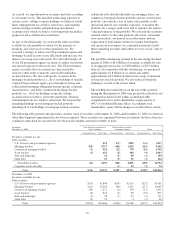
We realized net gains from sales of commercial mortgages of $55 million in 2006, $61 million in 2005 and $50 million in 2004.
Gains on sales of education loans totaled $33 million in 2006, $19 million in 2005 and $30 million in 2004. Net gains in excess of
valuation adjustments related to the liquidation of our institutional loans held for sale totaled $7 million in 2005 and $52 million in
2004.
Concentrations of credit risk exist when changes in economic, industry or geographic factors similarly affect groups of
counterparties whose aggregate exposure is material in relation to our total credit exposure. Loans outstanding and related
unfunded commitments are concentrated in our primary geographic markets. At December 31, 2006, no specific industry
concentration exceeded 3% of total commercial loans outstanding and unfunded commitments.
In the normal course of business, we originate or purchase loan products whose contractual features, when concentrated, may
increase our exposure as a holder and servicer of those loan products. Possible product terms and features that may create a
concentration of credit risk would include loan products whose terms permit negative amortization, a high loan-to-value ratio,
features that may expose the borrower to future increases in repayments above increases in market interest rates, below-market
interest rates and interest-only loans, among others.
We originate interest-only loans to commercial borrowers. These products are standard in the financial services industry and the
features of these products are considered during the underwriting process to mitigate the increased risk of this product feature that
may result in borrowers not being able to make interest and principal payments when due. We do not believe that these product
features create a concentration of credit risk.
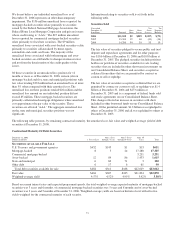
We also originate home equity loans and lines of credit that result in a credit concentration of high loan-to-value ratio loan products
at the time of origination. In addition, these loans are concentrated in our primary geographic markets as discussed above. At
December 31, 2006, $5.8 billion of the $15.4 billion of home equity and other consumer loans (included in “Consumer” in the table
above) had a loan-to-value ratio greater than 80%. These loans are collateralized primarily by 1-4 family residential properties. As
part of our asset and liability management activities, we also periodically purchase residential mortgage loans that are
collateralized by 1-4 family residential properties. At December 31, 2006, $2.6 billion of the $6.3 billion of residential mortgage
loans were interest-only loans.
During the third quarter of 2006, we announced our plan to sell or securitize approximately $2.1 billion of loans from our
residential mortgage portfolio. These transactions were substantially consummated during the fourth quarter of 2006. In accordance
with GAAP, these loans were transferred to loans held for sale as of September 30, 2006. We recognized a pretax loss in the third
quarter of 2006 of $48 million as a reduction of noninterest income, representing the mark to market valuation of these loans upon
transfer to held for sale status. This loss, which is reported in the “Other” business segment, represented the decline in value of the
loans almost entirely from the impact of increases in interest rates over the holding period.
92