PNC Bank 2006 Annual Report Download - page 72
Download and view the complete annual report
Please find page 72 of the 2006 PNC Bank annual report below. You can navigate through the pages in the report by either clicking on the pages listed below, or by using the keyword search tool below to find specific information within the annual report.-
 1
1 -
2
-
3
-
4
-
5
-
6
-
7
-
8
-
9
-
10
-
11
-
12
-
13
-
14
-
15
-
16
-
17
-
18
-
19
-
20
-
21
-
22
-
23
-
24
-
25
-
26
-
27
-
28
-
29
-
30
-
31
-
32
-
33
-
34
-
35
-
36
-
37
-
38
-
39
-
40
-
41
-
42
-
43
-
44
-
45
-
46
-
47
-
48
-
49
-
50
-
51
-
52
-
53
-
54
-
55
-
56
-
57
-
58
-
59
-
60
-
61
-
 62
62 -
 63
63 -
 64
64 -
 65
65 -
 66
66 -
 67
67 -
 68
68 -
 69
69 -
 70
70 -
 71
71 -
 72
72 -
 73
73 -
 74
74 -
 75
75 -
 76
76 -
 77
77 -
 78
78 -
 79
79 -
 80
80 -
 81
81 -
 82
82 -
83
-
84
-
85
-
86
-
87
-
88
-
89
-
90
-
91
-
92
-
93
-
94
-
95
-
96
-
97
-
98
-
99
-
100
-
101
-
102
-
103
-
104
-
105
-
106
-
107
-
108
-
109
-
110
-
111
-
112
-
113
-
114
-
115
-
116
-
117
-
118
-
119
-
120
-
121
-
122
-
123
-
124
-
125
-
126
-
127
-
128
-
129
-
130
-
131
-
132
-
133
-
134
-
135
-
136
-
137
-
138
-
139
-
140
-
141
-
142
-
143
-
144
-
145
-
146
-
147
 |
 |

• Demand for commercial loans, including commercial
real estate loans grew during the year, reflected in the
$3.1 billion increase in these loan categories.
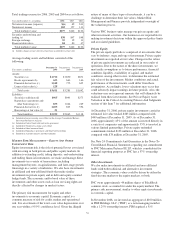
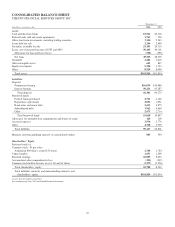
Securities
Total securities at December 31, 2005 were $20.7 billion
compared with $16.8 billion at December 31, 2004. Securities
represented 23% of total assets at December 31, 2005
compared with 21% at December 31, 2004. The increase in
total securities compared with December 31, 2004 was
primarily due to increases in mortgage-backed securities and
commercial mortgage-backed securities, partially offset by
declines in US Treasury and government agencies and asset-
backed securities. The increase in 2005 also reflected the
impact of Riggs.
At December 31, 2005, the securities available for sale
balance included a net unrealized loss of $370 million, which
represented the difference between fair value and amortized
cost. The comparable amount at December 31, 2004 was a net
unrealized loss of $102 million. The impact on bond prices of
increases in interest rates during 2005 was reflected in the net
unrealized loss position at December 31, 2005. The expected
weighted-average life of securities available for sale was 4
years and 1 month at December 31, 2005 compared with 2
years and 8 months at December 31, 2004.
Loans Held For Sale
Education loans held for sale totaled $1.9 billion at
December 31, 2005, and $1.1 billion at December 31, 2004
and represented the majority of our loans held for sale at each
date. Gains on sales of education loans totaled $19 million for
2005 and $30 million for 2004. These gains are reflected in
the other noninterest income line item in our Consolidated
Income Statement.
Asset Quality
Nonperforming assets were $216 million at December 31,
2005, an increase of $41 million from December 31, 2004.
The increase in nonperforming assets was primarily due to an
increase in nonaccrual asset-based loans. The ratio of
nonperforming assets to total loans, loans held for sale and
foreclosed assets was .42% at December 31, 2005 compared
with .39% at December 31, 2004. The allowance for loan and
lease losses was $596 million and represented 1.21% of total
loans and 314% of nonperforming loans at December 31,
2005. The comparable amounts were $607 million, 1.40% and
424%, respectively, at December 31, 2004.
Funding Sources
Total funding sources were $77.2 billion at December 31,
2005 and $65.2 billion at December 31, 2004. The increase of
$12 billion in funding sources was comprised of a $7 billion
increase in total deposits and a $5 billion increase in total
borrowed funds. The increase in deposits reflected sales and
retention efforts related to core deposits as well as the impact
of our expansion into the greater Washington, DC area.
Higher borrowed funds at December 31, 2005 were driven in
part by the following 2005 transactions:
• Senior bank note issuances totaling $925 million,
• Senior debt issuances of $1.1 billion and
BlackRock’s issuance of $250 million of convertible
debentures,
• Subordinated bank debt issuance of $500 million and
the assumption of $345 million of subordinated debt
related to the Riggs transaction,
• $1 billion of FHLB advances, and
• Higher short-term borrowings to fund asset growth.
These increases were partially offset by maturities of $750
million of senior bank notes and $350 million of subordinated
debt during 2005.
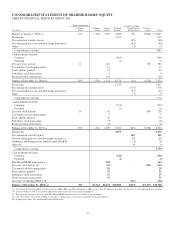
Shareholders’ Equity
The increase of $1.1 billion, to $8.6 billion, in total
shareholders’ equity at December 31, 2005 compared with the
prior year-end was primarily attributable to the impact of
retained earnings of $750 million and the issuance of
$356 million of shares in connection with the Riggs
acquisition.
Regulatory capital ratios at December 31, 2005 were 7.2% for
leverage, 8.3% for tier 1 risk-based and 12.1% for total risk-
based capital. At December 31, 2004, the regulatory capital
ratios were 7.6% for leverage, 9.0% for tier 1 risk-based and
13.0% for total risk-based capital.
Glossary of Terms
Accounting/administration net fund assets - Net domestic and
foreign fund investment assets for which we provide
accounting and administration services. We do not include
these assets on our Consolidated Balance Sheet.
Adjusted average total assets - Primarily comprised of total
average quarterly (or annual) assets plus (less) unrealized
losses (gains) on available-for-sale debt securities, less
goodwill and certain other intangible assets (net of eligible
deferred taxes).
Annualized - Adjusted to reflect a full year of activity.
Assets under management - Assets over which we have sole or
shared investment authority for our customers/clients. We do
not include these assets on our Consolidated Balance Sheet.
Basis point - One hundredth of a percentage point.
Charge-off - Process of removing a loan or portion of a loan
from our balance sheet because it is considered uncollectible.
We also record a charge-off when a loan is transferred to held
for sale by reducing the loan’s carrying amount by the
allowance for loan losses associated with such loan or if the
loan’s market value is less than its carrying amount.
62