PNC Bank 2006 Annual Report Download - page 66
Download and view the complete annual report
Please find page 66 of the 2006 PNC Bank annual report below. You can navigate through the pages in the report by either clicking on the pages listed below, or by using the keyword search tool below to find specific information within the annual report.-
 1
1 -
2
-
3
-
4
-
5
-
6
-
7
-
8
-
9
-
10
-
11
-
12
-
13
-
14
-
15
-
16
-
17
-
18
-
19
-
20
-
21
-
22
-
23
-
24
-
25
-
26
-
27
-
28
-
29
-
30
-
31
-
32
-
33
-
34
-
35
-
36
-
37
-
38
-
39
-
40
-
41
-
42
-
43
-
44
-
45
-
46
-
47
-
48
-
49
-
50
-
51
-
52
-
53
-
54
-
55
-
 56
56 -
 57
57 -
 58
58 -
 59
59 -
 60
60 -
 61
61 -
 62
62 -
 63
63 -
 64
64 -
 65
65 -
 66
66 -
 67
67 -
 68
68 -
 69
69 -
 70
70 -
 71
71 -
 72
72 -
 73
73 -
 74
74 -
 75
75 -
 76
76 -
77
-
78
-
79
-
80
-
81
-
82
-
83
-
84
-
85
-
86
-
87
-
88
-
89
-
90
-
91
-
92
-
93
-
94
-
95
-
96
-
97
-
98
-
99
-
100
-
101
-
102
-
103
-
104
-
105
-
106
-
107
-
108
-
109
-
110
-
111
-
112
-
113
-
114
-
115
-
116
-
117
-
118
-
119
-
120
-
121
-
122
-
123
-
124
-
125
-
126
-
127
-
128
-
129
-
130
-
131
-
132
-
133
-
134
-
135
-
136
-
137
-
138
-
139
-
140
-
141
-
142
-
143
-
144
-
145
-
146
-
147
 |
 |

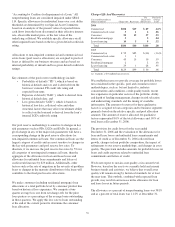
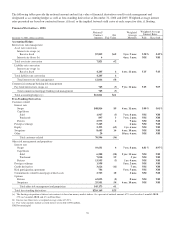
Total trading revenue for 2006, 2005 and 2004 was as follows:
Year end December 31 - in millions 2006 2005 2004
Net interest income (expense) $(6) $9 $13
Noninterest income 183 157 113
Total trading revenue $177 $166 $126
Securities underwriting and
trading (a) $38 $47 $48
Foreign exchange 55 39 31
Financial derivatives 84 80 47
Total trading revenue $177 $166 $126
(a) Includes changes in fair value for certain loans accounted for at fair value.
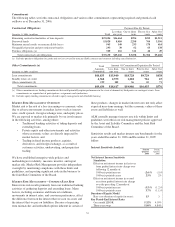
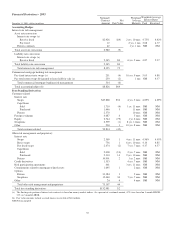
Average trading assets and liabilities consisted of the
following:
Year ended - in millions
December 31
2006
December 31
2005
December 31
2004
Assets
Securities (a) $1,712 $1,850 $871
Resale agreements (b) 623 663 166
Financial derivatives (c) 1,148 772 605
Loans at fair value (c) 128
Total assets $3,611 $3,285 $1,642
Liabilities
Securities sold short (d) $965 $993 $275
Repurchase agreements and
other borrowings (e) 833 1,044 249
Financial derivatives (f) 1,103 825 594
Borrowings at fair value (f) 31
Total liabilities $2,932 $2,862 $1,118
(a) Included in Interest-earning assets-Other on the Average Consolidated Balance
Sheet And Net Interest Analysis.
(b) Included in Federal funds sold and resale agreements.
(c) Included in Noninterest-earning assets-Other.
(d) Included in Other borrowed funds.
(e) Included in Repurchase agreements and Other borrowed funds.
(f) Included in Accrued expenses and other liabilities.
M
ARKET
R
ISK
M
ANAGEMENT
–E
QUITY
A
ND
O
THER
I
NVESTMENT
R
ISK
Equity investment risk is the risk of potential losses associated
with investing in both private and public equity markets. In
addition to extending credit, taking deposits, and underwriting
and trading financial instruments, we make and manage direct
investments in a variety of transactions, including
management buyouts, recapitalizations, and later-stage growth
financings in a variety of industries. We also have investments
in affiliated and non-affiliated funds that make similar
investments in private equity and in debt and equity-oriented
hedge funds. The economic and/or book value of these
investments and other assets such as loan servicing rights are
directly affected by changes in market factors.
The primary risk measurement for equity and other
investments is economic capital. Economic capital is a
common measure of risk for credit, market and operational
risk. It is an estimate of the worst-case value depreciation over
one year within a 99.9% confidence level. Given the illiquid
nature of many of these types of investments, it can be a
challenge to determine their fair values. Market Risk
Management and Finance provide independent oversight of
the valuation process.
Various PNC business units manage our private equity and
other investment activities. Our businesses are responsible for
making investment decisions within the approved policy limits
and associated guidelines.
Private Equity
The private equity portfolio is comprised of investments that
vary by industry, stage and type of investment. Private equity
investments are reported at fair value. Changes in the values
of private equity investments are reflected in our results of
operations. Due to the nature of the direct investments, we
must make assumptions as to future performance, financial
condition, liquidity, availability of capital, and market
conditions, among other factors, to determine the estimated
fair value of the investments. Market conditions and actual
performance of the investments could differ from these
assumptions. Accordingly, lower valuations may occur that
could adversely impact earnings in future periods. Also, the
valuations may not represent amounts that will ultimately be
realized from these investments. See Private Equity Asset
Valuation in the Critical Accounting Policies And Judgments
section of this Item 7 for additional information.
At December 31, 2006, private equity investments carried at
estimated fair value totaled $463 million compared with
$449 million at December 31, 2005. As of December 31,
2006, approximately 45% of the amount is invested directly in
a variety of companies and approximately 55% is invested in
various limited partnerships. Private equity unfunded
commitments totaled $123 million at December 31, 2006
compared with $78 million at December 31, 2005.
See Note 24 Commitments And Guarantees in the Notes To
Consolidated Financial Statements regarding our commitment
to PNC Mezzanine Partners III, LP, which is consolidated for
financial reporting purposes as PNC has a 57% ownership
interest.
Other Investments
We also make investments in affiliated and non-affiliated
funds with both traditional and alternative investment
strategies. The economic values could be driven by either the
fixed-income market or the equity markets, or both.
PNC owns approximately 44 million shares of BlackRock
common stock, accounted for under the equity method. The
primary risk measurement, similar to other equity investments,
is economic capital.
In November 2006, we invested an aggregate of $100 million
in FIM Holdings, LLC (“FIM”) as a non-managing member
with a 1.25% ownership interest. FIM acquired a 51%
56