PNC Bank 2006 Annual Report Download - page 101
Download and view the complete annual report
Please find page 101 of the 2006 PNC Bank annual report below. You can navigate through the pages in the report by either clicking on the pages listed below, or by using the keyword search tool below to find specific information within the annual report.-
 1
1 -
2
-
3
-
4
-
5
-
6
-
7
-
8
-
9
-
10
-
11
-
12
-
13
-
14
-
15
-
16
-
17
-
18
-
19
-
20
-
21
-
22
-
23
-
24
-
25
-
26
-
27
-
28
-
29
-
30
-
31
-
32
-
33
-
34
-
35
-
36
-
37
-
38
-
39
-
40
-
41
-
42
-
43
-
44
-
45
-
46
-
47
-
48
-
49
-
50
-
51
-
52
-
53
-
54
-
55
-
56
-
57
-
58
-
59
-
60
-
61
-
62
-
63
-
64
-
65
-
66
-
67
-
68
-
69
-
70
-
71
-
72
-
73
-
74
-
75
-
76
-
77
-
78
-
79
-
80
-
81
-
82
-
83
-
84
-
85
-
86
-
87
-
88
-
89
-
90
-
 91
91 -
 92
92 -
 93
93 -
 94
94 -
 95
95 -
 96
96 -
 97
97 -
 98
98 -
 99
99 -
 100
100 -
 101
101 -
 102
102 -
 103
103 -
 104
104 -
 105
105 -
 106
106 -
 107
107 -
 108
108 -
 109
109 -
 110
110 -
 111
111 -
112
-
113
-
114
-
115
-
116
-
117
-
118
-
119
-
120
-
121
-
122
-
123
-
124
-
125
-
126
-
127
-
128
-
129
-
130
-
131
-
132
-
133
-
134
-
135
-
136
-
137
-
138
-
139
-
140
-
141
-
142
-
143
-
144
-
145
-
146
-
147
 |
 |

We do not believe any individual unrealized loss as of
December 31, 2006 represents an other-than-temporary
impairment. The $156 million unrealized losses reported for
mortgage-backed securities relate primarily to securities
issued by the Federal National Mortgage Association, the
Federal Home Loan Mortgage Corporation and private issuers
whose credit rating is “AAA.” The $25 million unrealized
losses reported for commercial mortgage-backed securities
relate primarily to fixed rate securities. The $9 million
unrealized losses associated with asset-backed securities relate
primarily to securities collateralized by home equity,
automobile and credit card loans. The majority of the
unrealized losses associated with both mortgage and asset-
backed securities are attributable to changes in interest rates
and not from the deterioration of the credit quality of the
issuer.
Of those securities in an unrealized loss position for 12
months or more as of December 31, 2006, sixteen (eleven
mortgage-backed and five state and municipal) positions with
fair value totaling $333 million had an unrealized loss of more
than 5% when compared with their amortized cost. The
unrealized loss on these positions totaled $26 million and the
unrealized loss amount on any individual position did not
exceed $5 million. These mortgage-backed securities are
primarily collateralized mortgage obligations where amortized
cost approximates the par value of the security. These
securities are all rated “AAA.” The aggregate unrealized loss
on the state and municipal securities positions was not
significant.
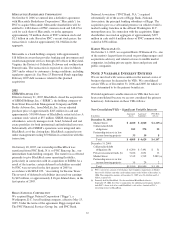
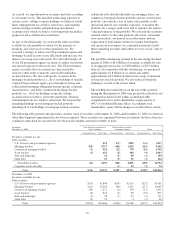
Information relating to securities sold is set forth in the
following table.
Securities Sold
Year ended
December 31
In millions Proceeds
Gross
Gains
Gross
Losses
Net
Gains
(Losses)
Tax
Expense
(Benefit)
2006 $11,102 $2 $209 $(207) $(72)
2005 13,304 19 60 (41) (14)
2004 14,206 94 39 55 19
The fair value of securities pledged to secure public and trust
deposits and repurchase agreements and for other purposes
was $10.6 billion at December 31, 2006 and $10.8 billion at
December 31, 2005. The pledged securities include positions
held in our portfolio of securities available for sale, trading
securities that are included in other short-term investments on
our Consolidated Balance Sheet, and securities accepted as
collateral from others that we are permitted by contract or
custom to sell or repledge.
The fair value of securities accepted as collateral that we are
permitted by contract or custom to sell or repledge was $1.4
billion at December 31, 2006 and $273 million at
December 31, 2005 and is a component of federal funds sold
and resale agreements on our Consolidated Balance Sheet.
This change reflected an increase in securities sold short,
included in other borrowed funds on our Consolidated Balance
Sheet. Of the permitted amount, $1.3 billion was repledged to
others at December 31, 2006 and all was repledged to others at
December 31, 2005.
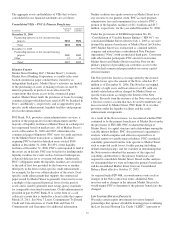
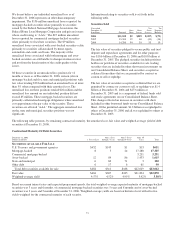
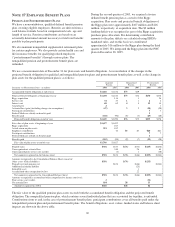
The following table presents, by remaining contractual maturity, the amortized cost, fair value and weighted-average yield of debt
securities at December 31, 2006.
Contractual Maturity Of Debt Securities
December 31, 2006
Dollars in millions 1 Year or Less
After 1 Year
through 5 Years
After 5 Years
through 10 Years
After 10
Years Total
S
ECURITIES
A
VAILABLE
F
OR
S
ALE
U.S. Treasury and government agencies $452 $145 $1 $13 $611
Mortgage-backed 8 5 24 17,288 17,325
Commercial mortgage-backed 3,231 3,231
Asset-backed 12 84 86 1,433 1,615
State and municipal 6 60 71 3 140
Other debt 6 17 6 61 90
Total debt securities available for sale $484 $311 $188 $22,029 $23,012
Fair value $484 $307 $185 $21,894 $22,870
Weighted-average yield 4.57% 4.52% 4.95% 5.42% 5.38%
Based on current interest rates and expected prepayment speeds, the total weighted-average expected maturity of mortgage-backed
securities was 3 years and 6 months, of commercial mortgage-backed securities was 5 years and 8 months and of asset-backed
securities was 2 years and 5 months at December 31, 2006. Weighted-average yields are based on historical cost with effective
yields weighted for the contractual maturity of each security.
91