PNC Bank 2006 Annual Report Download - page 27
Download and view the complete annual report
Please find page 27 of the 2006 PNC Bank annual report below. You can navigate through the pages in the report by either clicking on the pages listed below, or by using the keyword search tool below to find specific information within the annual report.-
 1
1 -
2
-
3
-
4
-
5
-
6
-
7
-
8
-
9
-
10
-
11
-
12
-
13
-
14
-
15
-
16
-
 17
17 -
 18
18 -
 19
19 -
 20
20 -
 21
21 -
 22
22 -
 23
23 -
 24
24 -
 25
25 -
 26
26 -
 27
27 -
 28
28 -
 29
29 -
 30
30 -
 31
31 -
 32
32 -
 33
33 -
 34
34 -
 35
35 -
 36
36 -
 37
37 -
38
-
39
-
40
-
41
-
42
-
43
-
44
-
45
-
46
-
47
-
48
-
49
-
50
-
51
-
52
-
53
-
54
-
55
-
56
-
57
-
58
-
59
-
60
-
61
-
62
-
63
-
64
-
65
-
66
-
67
-
68
-
69
-
70
-
71
-
72
-
73
-
74
-
75
-
76
-
77
-
78
-
79
-
80
-
81
-
82
-
83
-
84
-
85
-
86
-
87
-
88
-
89
-
90
-
91
-
92
-
93
-
94
-
95
-
96
-
97
-
98
-
99
-
100
-
101
-
102
-
103
-
104
-
105
-
106
-
107
-
108
-
109
-
110
-
111
-
112
-
113
-
114
-
115
-
116
-
117
-
118
-
119
-
120
-
121
-
122
-
123
-
124
-
125
-
126
-
127
-
128
-
129
-
130
-
131
-
132
-
133
-
134
-
135
-
136
-
137
-
138
-
139
-
140
-
141
-
142
-
143
-
144
-
145
-
146
-
147
 |
 |

Management section and “Perpetual Trust Securities” in the
Off-Balance Sheet Arrangements and VIEs section of Item 7
of this Report, and Note 4 Regulatory Matters in the Notes To
Consolidated Financial Statements in Item 8 of this Report,
which we include here by reference.
We include here by reference additional information relating
to PNC common stock under the caption “Common Stock
Prices/Dividends Declared” in the Statistical Information
(Unaudited) section of Item 8 of this Report.
We include here by reference the information regarding our
compensation plans under which PNC equity securities are
authorized for issuance as of December 31, 2006 in the table
(with introductory paragraph and notes) that appears under
Item 12 of this Report.
Our registrar, stock transfer agent, and dividend disbursing
agent is:
Computershare Investor Services, LLC
250 Royall Street
Canton, MA 02021
800-982-7652
(b) Not applicable.
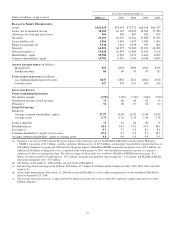
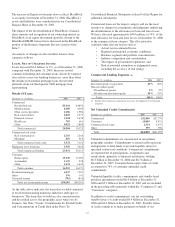
(c) Details of our repurchases of PNC common stock during
the fourth quarter of 2006 are included in the following table:
In thousands, except per share data
2006 period
Total shares
purchased (a)
Average
price
paid per
share
Total shares
purchased as
part of
publicly
announced
programs (b)
Maximum
number of
shares that
may yet be
purchased
under the
programs (b)
October 1 –
October 31 210 $70.95 95 15,732
November 1 –
November 30 871 $69.50 614 15,118
December 1 –
December 31 816 $73.09 615 14,503
Total 1,897 $71.21 1,324
(a) Includes PNC common stock purchased under the program referred to in
note (b) to this table and PNC common stock purchased in connection
with our various employee benefit plans.
(b) Our current stock repurchase program, which was authorized as of
February 16, 2005, allows us to purchase up to 20 million shares on the
open market or in privately negotiated transactions. This program will
remain in effect until fully utilized or until modified, superseded or
terminated.
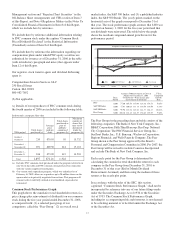
Common Stock Performance Graph
This graph shows the cumulative total shareholder return (i.e.,
price change plus reinvestment of dividends) on our common
stock during the five-year period ended December 31, 2006,
as compared with: (1) a selected peer group of our
competitors, called the “Peer Group;” (2) an overall stock
market index, the S&P 500 Index; and (3) a published industry
index, the S&P 500 Banks. The yearly points marked on the
horizontal axis of the graph correspond to December 31 of
that year. The stock performance graph assumes that $100 was
invested on January 1, 2002 for the five-year period and that
any dividends were reinvested. The table below the graph
shows the resultant compound annual growth rate for the
performance period.
Comparison of Cumulative Five Year Total Return
0
50
100
150
200
Dec01 Dec02 Dec03 Dec04 Dec05 Dec06
Dollars
PNC S&P 500 Index S&P 500 Banks Peer Group
Base
Period
Assumes $100 investment at Close of
Market on December 31, 2001
Total Return = Price change plus
reinvestment of dividends
5-Year
Compound
Growth
Rate
PNC $100 77.60 105.58 115.04 128.36 158.53 9.65%
S&P 500 Index $100 77.91 100.24 111.14 116.59 134.99 6.18%
S&P 500 Banks $100 98.96 125.34 143.42 141.37 164.17 10.42%
Peer Group $100 105.16 124.25 144.53 134.68 158.53 9.65%
The Peer Group for the preceding chart and table consists of the
following companies: The Bank of New York Company, Inc.;
BB&T Corporation; Fifth Third Bancorp; KeyCorp; National
City Corporation; The PNC Financial Services Group, Inc.;
SunTrust Banks, Inc.; U.S. Bancorp.; Wachovia Corporation;
Regions Financial; and Wells Fargo & Company. The Peer
Group shown is the Peer Group approved by the Board’s
Personnel and Compensation Committee in 2006. For 2007, the
Peer Group will be revised to include Comerica Incorporated
and exclude The Bank of New York Company, Inc.
Each yearly point for the Peer Group is determined by
calculating the cumulative total shareholder return for each
company in the Peer Group from December 31, 2001 to
December 31 of that year (End of Month Dividend
Reinvestment Assumed) and then using the median of these
returns as the yearly plot point.
In accordance with the rules of the SEC, this section,
captioned “Common Stock Performance Graph,” shall not be
incorporated by reference into any of our future filings made
under the Securities Exchange Act of 1934 or the Securities
Act of 1933. The Common Stock Performance Graph,
including its accompanying table and footnotes, is not deemed
to be soliciting material or to be filed under the Exchange Act
or the Securities Act.
17