Nokia 2015 Annual Report Download - page 60
Download and view the complete annual report
Please find page 60 of the 2015 Nokia annual report below. You can navigate through the pages in the report by either clicking on the pages listed below, or by using the keyword search tool below to find specific information within the annual report.-
 1
1 -
2
-
3
-
4
-
5
-
6
-
7
-
8
-
9
-
10
-
11
-
12
-
13
-
14
-
15
-
16
-
17
-
18
-
19
-
20
-
21
-
22
-
23
-
24
-
25
-
26
-
27
-
28
-
29
-
30
-
31
-
32
-
33
-
34
-
35
-
36
-
37
-
38
-
39
-
40
-
41
-
42
-
43
-
44
-
45
-
46
-
47
-
48
-
49
-
 50
50 -
 51
51 -
 52
52 -
 53
53 -
 54
54 -
 55
55 -
 56
56 -
 57
57 -
 58
58 -
 59
59 -
 60
60 -
 61
61 -
 62
62 -
 63
63 -
 64
64 -
 65
65 -
 66
66 -
 67
67 -
 68
68 -
 69
69 -
 70
70 -
71
-
72
-
73
-
74
-
75
-
76
-
77
-
78
-
79
-
80
-
81
-
82
-
83
-
84
-
85
-
86
-
87
-
88
-
89
-
90
-
91
-
92
-
93
-
94
-
95
-
96
-
97
-
98
-
99
-
100
-
101
-
102
-
103
-
104
-
105
-
106
-
107
-
108
-
109
-
110
-
111
-
112
-
113
-
114
-
115
-
116
-
117
-
118
-
119
-
120
-
121
-
122
-
123
-
124
-
125
-
126
-
127
-
128
-
129
-
130
-
131
-
132
-
133
-
134
-
135
-
136
-
137
-
138
-
139
-
140
-
141
-
142
-
143
-
144
-
145
-
146
-
147
-
148
-
149
-
150
-
151
-
152
-
153
-
154
-
155
-
156
-
157
-
158
-
159
-
160
-
161
-
162
-
163
-
164
-
165
-
166
-
167
-
168
-
169
-
170
-
171
-
172
-
173
-
174
-
175
-
176
-
177
-
178
-
179
-
180
-
181
-
182
-
183
-
184
-
185
-
186
-
187
-
188
-
189
-
190
-
191
-
192
-
193
-
194
-
195
-
196
-
197
-
198
-
199
-
200
-
201
-
202
-
203
-
204
-
205
-
206
-
207
-
208
-
209
-
210
-
211
-
212
-
213
-
214
-
215
-
216
 |
 |
58 NOKIA IN 2015
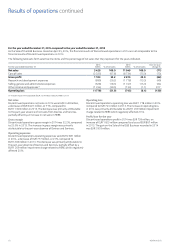
Liquidity and
capital resources
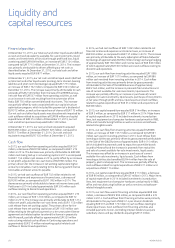
Financial position
At December 31, 2015, our total cash and other liquid assets (dened
as cash and cash equivalents; available-for-sale investments, liquid
assets; and investments at fair value through prot and loss, liquid
assets) equaled EUR 9 849 million, an increase of EUR 2 134 million,
compared to EUR 7 715 million at December 31, 2014. The increase
was primarily attributable to drivers aecting our net cash as
described below. At December 31, 2013, our total cash and other
liquid assets equaled EUR 8 971 million.
At December 31, 2015, our net cash and other liquid assets (dened
as total cash and other liquid assets less long-term interest-bearing
liabilities and short-term borrowings) equaled EUR 7 775 million,
anincrease of EUR 2 752 million, compared to EUR 5 023 million at
December 31, 2014. The increase was primarily attributable to cash
proceeds of EUR 2 536 million from the Sale of the HERE Business,
netcash ow of EUR 507 million from operating activities, as well
asanincrease in net cash resulting from the conversion of the
NokiaEUR750 million convertible bond into shares. This increase
waspartially oset by costs associated with our capital structure
optimization program, which included the payment of a dividend of
EUR 512 million, as well as the repurchase of shares of EUR 173 million.
Our net cash and other liquid assets was also adversely impacted by
cash outows related to acquisitions of EUR 98 million and capital
expenditures of EUR 314 million. At December 31, 2013, our net
cashand other liquid assets equaled EUR 2 309 million.
At December 31, 2015, our cash and cash equivalents equaled
EUR 6 995 million, an increase of EUR 1 825 million, compared to
EUR5170 million at December 31, 2014. Our cash and cash
equivalents equaled EUR 7 633 million at December 31, 2013.
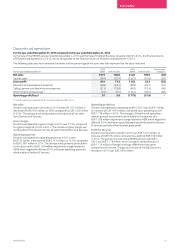
Cash ow
In 2015, our cash ow from operating activities equaled EUR 507
million, a decrease of EUR 768 million, as compared to EUR 1 275
million in 2014. The decrease was primarily attributable to EUR 998
million cash being tied up in net working capital in 2015 as compared
to EUR 1 153 million cash release in 2014, partly oset by an increase
in net prot, adjusted for non-cash items of EUR 993 million. The
primary drivers for the increase in net working capital were higher
accounts receivables, mainly relating to the Samsung patent license
receivables and lower accounts payable.
In 2015, we had cash outows of EUR 702 million related to net
nancial income and expenses and income taxes, a decrease of
EUR390 million, as compared to EUR 1 092 million in 2014. The
decrease was primarily attributable to lower net income taxes paid.
Paid taxes in2014 included approximately EUR 300 million cash
outows relating to Discontinued operations.
In 2014, our cash ow from operating activities equaled EUR 1 275
million, an increase of EUR 1 203 million, as compared to EUR 72
million in 2013. The increase was primarily attributable to EUR 1 214
million net prot, adjusted for non-cash items and a EUR 1 153 million
cash release from net working capital. The primary driver for the
cashrelease from net working capital was a EUR 1 650 million cash
inow relating to the upfront payment on a ten-year patent license
agreement and related option to extend the license in perpetuity
withMicrosoft, partially oset by approximately EUR 320 million
restructuring-related cash outows in Continuing operations and
approximately EUR 210 million net working capital-related cash
outows in Discontinued operations.
In 2014, we had cash outows of EUR 1 092 million related to net
nancial income and expenses and income taxes, an increase of
EUR935 million, as compared to EUR 157 million in 2013. The increase
was primarily attributable to the early redemption of Nokia Networks’
borrowings of approximately EUR 84 million, foreign exchange hedging
of approximately EUR 180 million and income taxes of EUR 636 million,
of which approximately EUR 300 million were cash outows relating to
discontinued operations.
In 2015, our cash ow from investing activities equaled EUR 1 896
million, an increase of EUR 1 010 million, as compared to EUR 886
million cash received from investing activities in 2014. Cash inow
from investing activities was primarily driven by gross proceeds
attributable to the Sale of the HERE Business of approximately
EUR2540 million, and the increase in proceeds from maturities and
sale of current available-for-sale investments, liquid assets. The
increase was partially oset by an increase in purchases of current
available-for-sale investments, liquid assets, purchases of investments
at fair value through prot and loss, liquid assets and cash outows
related to capital expenditure of EUR 314 million and acquisitions of
EUR 98 million.
In 2015, our capital expenditure equaled EUR 314 million, an increase
of EUR 3 million, as compared to EUR 311 million in 2014. Major items
of capital expenditure in 2015 included investments in production
lines, test equipment and computer hardware used primarily in R&D,
oce and manufacturing facilities as well as services and software
related intangible assets.
In 2014, our cash ow from investing activities equaled EUR 886
million, an increase of EUR 1 577 million, as compared to EUR 691
million cash used in investing activities in 2013. Cash inows from
investing activities was primarily driven by gross proceeds attributable
to the Sale of the D&S Business of approximately EUR 4 010 million,
which included the proceeds used to repay the convertible bonds
issued to Microsoft and the increase in proceeds from maturities
andsale of current available-for-sale investments, liquid assets.
Theincrease was oset by an increase in purchases of current
available-for-sale investments, liquid assets. Cash inows from
investing activities also beneted EUR 44 million from the sale of
property, plant and equipment. The increase was partially oset by
cash outows related to capital expenditure of EUR 311 million and
acquisitions of EUR 175 million.
In 2014, our capital expenditure equaled EUR 311 million, a decrease
of EUR 96 million, as compared to EUR 407 million in 2013. Major items
of capital expenditure in 2014 included investments in production
lines, test equipment and computer hardware used primarily in R&D,
oce and manufacturing facilities as well as services and software-
related intangible assets.
In 2015, our cash ow used in nancing activities equaled EUR 584
million, a decrease of EUR 3 992 million, as compared to EUR 4 576
million in 2014. Cash outows from nancing activities were primarily
attributable to the payment of EUR 0.14 per share in dividends
equaling EUR 507 and EUR 173 million in cash outows relating to
share repurchases. Cash outows from nancing activities also
included payments to non-controlling interest holders to acquire
subsidiary shares and pay dividends equaling EUR 57 million.