Nokia 2015 Annual Report Download - page 185
Download and view the complete annual report
Please find page 185 of the 2015 Nokia annual report below. You can navigate through the pages in the report by either clicking on the pages listed below, or by using the keyword search tool below to find specific information within the annual report.-
 1
1 -
2
-
3
-
4
-
5
-
6
-
7
-
8
-
9
-
10
-
11
-
12
-
13
-
14
-
15
-
16
-
17
-
18
-
19
-
20
-
21
-
22
-
23
-
24
-
25
-
26
-
27
-
28
-
29
-
30
-
31
-
32
-
33
-
34
-
35
-
36
-
37
-
38
-
39
-
40
-
41
-
42
-
43
-
44
-
45
-
46
-
47
-
48
-
49
-
50
-
51
-
52
-
53
-
54
-
55
-
56
-
57
-
58
-
59
-
60
-
61
-
62
-
63
-
64
-
65
-
66
-
67
-
68
-
69
-
70
-
71
-
72
-
73
-
74
-
75
-
76
-
77
-
78
-
79
-
80
-
81
-
82
-
83
-
84
-
85
-
86
-
87
-
88
-
89
-
90
-
91
-
92
-
93
-
94
-
95
-
96
-
97
-
98
-
99
-
100
-
101
-
102
-
103
-
104
-
105
-
106
-
107
-
108
-
109
-
110
-
111
-
112
-
113
-
114
-
115
-
116
-
117
-
118
-
119
-
120
-
121
-
122
-
123
-
124
-
125
-
126
-
127
-
128
-
129
-
130
-
131
-
132
-
133
-
134
-
135
-
136
-
137
-
138
-
139
-
140
-
141
-
142
-
143
-
144
-
145
-
146
-
147
-
148
-
149
-
150
-
151
-
152
-
153
-
154
-
155
-
156
-
157
-
158
-
159
-
160
-
161
-
162
-
163
-
164
-
165
-
166
-
167
-
168
-
169
-
170
-
171
-
172
-
173
-
174
-
 175
175 -
 176
176 -
 177
177 -
 178
178 -
 179
179 -
 180
180 -
 181
181 -
 182
182 -
 183
183 -
 184
184 -
 185
185 -
 186
186 -
 187
187 -
 188
188 -
 189
189 -
 190
190 -
 191
191 -
 192
192 -
 193
193 -
 194
194 -
 195
195 -
196
-
197
-
198
-
199
-
200
-
201
-
202
-
203
-
204
-
205
-
206
-
207
-
208
-
209
-
210
-
211
-
212
-
213
-
214
-
215
-
216
 |
 |

183
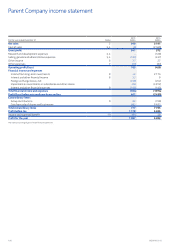
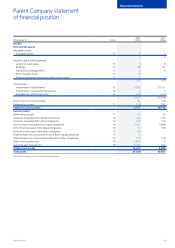
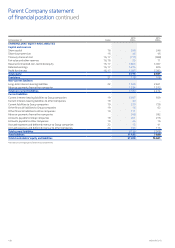
Financial statements
NOKIA IN 2015
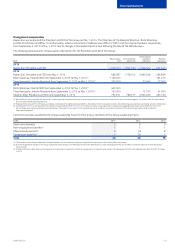
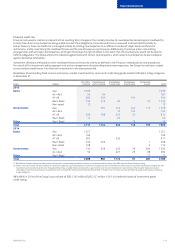
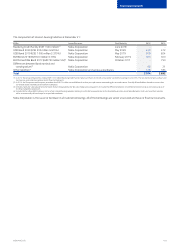
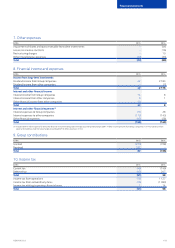
EURm Total
Due within
3 months
Due between 3
and 12 months
Due between
1 and 3 years
Due between
3 and 5 years
Due beyond
5 years
2014
Non-current nancial assets
Long-term loans receivable 38 – – 22 –16
Current nancial assets
Current portion of long-term loans receivable 2 1 1 – – –
Short-term loans receivable 24 24 – – – –
Investments at fair value through prot and loss 501 1 5 261 10 224
Available-for-sale investments, including cash equivalents(1) 4 806 2 609 904 926 68 299
Bank and cash 2 527 2 527 – – – –
Cash ows related to derivative nancial assets net settled:
Derivative contract—receipts 127 17 (4) 27 34 53
Cash ows related to derivative nancial assets gross settled:
Derivative contracts—receipts 4 982 4 439 54 44 445 –
Derivative contracts—payments (4 800) (4 355) (38) (17) (390) –
Accounts receivable(2) 2 727 2 135 592 – – –
Non-current nancial liabilities
Long-term interest-bearing liabilities (3 786) (34) (113) (1 044) (1 520) (1 075)
Current nancial liabilities
Current portion of long-term interest-bearing liabilities – – – – – –
Short-term borrowings (115) (113) (2) –––
Cash ows related to derivative nancial liabilities net settled:
Derivative contracts—payments (101) –(4) (8) (8) (81)
Cash ows related to derivative nancial liabilities gross settled:
Derivative contracts—receipts 5 065 5 065 – – – –
Derivative contracts—payments (5 203) (5 203) – – – –
Accounts payable (2 313) (2 212) (101) – – –
Contingent nancial assets and liabilities
Loan commitments given undrawn(3) (155) (8) (49) (68) (30) –
Loan commitments obtained undrawn(4) 1 493 (1) (2) 1 496 – –
(1) Instruments that include a call feature have been presented at their nal maturities.
(2) Accounts receivable maturity analysis does not include accrued receivables of EUR 1 285 million (EUR 703 million in 2014).
(3) Loan commitments given undrawn have been included in the earliest period in which they could be drawn or called.
(4) Loan commitments obtained undrawn have been included based on the period in which they expire. These amounts include related commitment fees.