Nokia 2015 Annual Report Download - page 161
Download and view the complete annual report
Please find page 161 of the 2015 Nokia annual report below. You can navigate through the pages in the report by either clicking on the pages listed below, or by using the keyword search tool below to find specific information within the annual report.-
 1
1 -
2
-
3
-
4
-
5
-
6
-
7
-
8
-
9
-
10
-
11
-
12
-
13
-
14
-
15
-
16
-
17
-
18
-
19
-
20
-
21
-
22
-
23
-
24
-
25
-
26
-
27
-
28
-
29
-
30
-
31
-
32
-
33
-
34
-
35
-
36
-
37
-
38
-
39
-
40
-
41
-
42
-
43
-
44
-
45
-
46
-
47
-
48
-
49
-
50
-
51
-
52
-
53
-
54
-
55
-
56
-
57
-
58
-
59
-
60
-
61
-
62
-
63
-
64
-
65
-
66
-
67
-
68
-
69
-
70
-
71
-
72
-
73
-
74
-
75
-
76
-
77
-
78
-
79
-
80
-
81
-
82
-
83
-
84
-
85
-
86
-
87
-
88
-
89
-
90
-
91
-
92
-
93
-
94
-
95
-
96
-
97
-
98
-
99
-
100
-
101
-
102
-
103
-
104
-
105
-
106
-
107
-
108
-
109
-
110
-
111
-
112
-
113
-
114
-
115
-
116
-
117
-
118
-
119
-
120
-
121
-
122
-
123
-
124
-
125
-
126
-
127
-
128
-
129
-
130
-
131
-
132
-
133
-
134
-
135
-
136
-
137
-
138
-
139
-
140
-
141
-
142
-
143
-
144
-
145
-
146
-
147
-
148
-
149
-
150
-
 151
151 -
 152
152 -
 153
153 -
 154
154 -
 155
155 -
 156
156 -
 157
157 -
 158
158 -
 159
159 -
 160
160 -
 161
161 -
 162
162 -
 163
163 -
 164
164 -
 165
165 -
 166
166 -
 167
167 -
 168
168 -
 169
169 -
 170
170 -
 171
171 -
172
-
173
-
174
-
175
-
176
-
177
-
178
-
179
-
180
-
181
-
182
-
183
-
184
-
185
-
186
-
187
-
188
-
189
-
190
-
191
-
192
-
193
-
194
-
195
-
196
-
197
-
198
-
199
-
200
-
201
-
202
-
203
-
204
-
205
-
206
-
207
-
208
-
209
-
210
-
211
-
212
-
213
-
214
-
215
-
216
 |
 |
159
Financial statements
NOKIA IN 2015
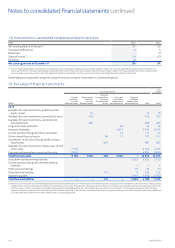
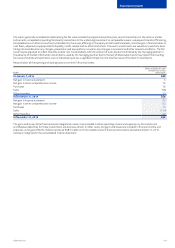
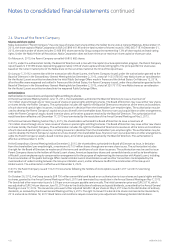
The inputs generally considered in determining the fair value include the original transaction price, recent transactions in the same or similar
instruments, completed or pending third-party transactions in the underlying investment or comparable issuers, subsequent rounds of nancing,
recapitalizations or other transactions undertaken by the issuer, oerings in the equity or debt capital markets, and changes in nancial ratios or
cash ows, adjusted as appropriate for liquidity, credit, market and/or other risk factors. The level 3 investments are valued ona quarterly basis
taking into consideration any changes, projections and assumptions, as well as any changes in economic and other relevant conditions. The fair
value may be adjusted to reect illiquidity and/or non-transferability, with the amount of such discount estimated by the managing partner in
the absence of market information. Assumptions used by the managing partner due to the lack of observable inputs may impact the resulting
fair value of individual investments, but no individual input has a signicant impact on the total fair value of the level 3 investments.
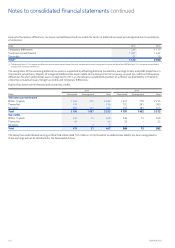
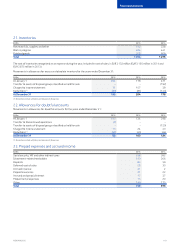
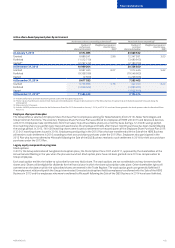
Reconciliation of the opening and closing balances on level 3 nancial assets:
EURm
Other available-for-sale
investments carried
at fair value
At January 1, 2014 429
Net gain in income statement 5
Net gain in other comprehensive income 72
Purchases 78
Sales (58)
Other transfers 30
At December 31, 2014 556
Net gain in income statement 96
Net gain in other comprehensive income 83
Purchases 70
Sales (146)
Other transfers 29
At December 31, 2015 688
The gains and losses from nancial assets categorized in level 3 are included in other operating income and expenses as the investment
anddisposal objectives for these investments are business-driven. In other cases, the gains and losses are included in nancial income and
expenses. A net gain of EUR 4 million (net loss of EUR 2 million in 2014) related to level 3 nancial instruments held at December 31, 2015
hasbeen recognized in the consolidated income statement.