Nokia 2015 Annual Report Download - page 145
Download and view the complete annual report
Please find page 145 of the 2015 Nokia annual report below. You can navigate through the pages in the report by either clicking on the pages listed below, or by using the keyword search tool below to find specific information within the annual report.-
 1
1 -
 2
2 -
 3
3 -
 4
4 -
 5
5 -
 6
6 -
 7
7 -
 8
8 -
 9
9 -
 10
10 -
 11
11 -
 12
12 -
 13
13 -
 14
14 -
 15
15 -
 16
16 -
 17
17 -
 18
18 -
 19
19 -
 20
20 -
 21
21 -
 22
22 -
 23
23 -
 24
24 -
 25
25 -
 26
26 -
 27
27 -
 28
28 -
 29
29 -
 30
30 -
 31
31 -
 32
32 -
 33
33 -
 34
34 -
 35
35 -
 36
36 -
 37
37 -
 38
38 -
 39
39 -
 40
40 -
 41
41 -
 42
42 -
 43
43 -
 44
44 -
 45
45 -
 46
46 -
 47
47 -
 48
48 -
 49
49 -
 50
50 -
 51
51 -
 52
52 -
 53
53 -
 54
54 -
 55
55 -
 56
56 -
 57
57 -
 58
58 -
 59
59 -
 60
60 -
 61
61 -
 62
62 -
 63
63 -
 64
64 -
 65
65 -
 66
66 -
 67
67 -
 68
68 -
 69
69 -
 70
70 -
 71
71 -
 72
72 -
 73
73 -
 74
74 -
 75
75 -
 76
76 -
 77
77 -
 78
78 -
 79
79 -
 80
80 -
 81
81 -
 82
82 -
 83
83 -
 84
84 -
 85
85 -
 86
86 -
 87
87 -
 88
88 -
 89
89 -
 90
90 -
 91
91 -
 92
92 -
 93
93 -
 94
94 -
 95
95 -
 96
96 -
 97
97 -
 98
98 -
 99
99 -
 100
100 -
 101
101 -
 102
102 -
 103
103 -
 104
104 -
 105
105 -
 106
106 -
 107
107 -
 108
108 -
 109
109 -
 110
110 -
 111
111 -
 112
112 -
 113
113 -
 114
114 -
 115
115 -
 116
116 -
 117
117 -
 118
118 -
 119
119 -
 120
120 -
 121
121 -
 122
122 -
 123
123 -
 124
124 -
 125
125 -
 126
126 -
 127
127 -
 128
128 -
 129
129 -
 130
130 -
 131
131 -
 132
132 -
 133
133 -
 134
134 -
 135
135 -
 136
136 -
 137
137 -
 138
138 -
 139
139 -
 140
140 -
 141
141 -
 142
142 -
 143
143 -
 144
144 -
 145
145 -
 146
146 -
 147
147 -
 148
148 -
 149
149 -
 150
150 -
 151
151 -
 152
152 -
 153
153 -
 154
154 -
 155
155 -
 156
156 -
 157
157 -
 158
158 -
 159
159 -
 160
160 -
 161
161 -
 162
162 -
 163
163 -
 164
164 -
 165
165 -
 166
166 -
 167
167 -
 168
168 -
 169
169 -
 170
170 -
 171
171 -
 172
172 -
 173
173 -
 174
174 -
 175
175 -
 176
176 -
 177
177 -
 178
178 -
 179
179 -
 180
180 -
 181
181 -
 182
182 -
 183
183 -
 184
184 -
 185
185 -
 186
186 -
 187
187 -
 188
188 -
 189
189 -
 190
190 -
 191
191 -
 192
192 -
 193
193 -
 194
194 -
 195
195 -
 196
196 -
 197
197 -
 198
198 -
 199
199 -
 200
200 -
 201
201 -
 202
202 -
 203
203 -
 204
204 -
 205
205 -
 206
206 -
 207
207 -
 208
208 -
 209
209 -
 210
210 -
 211
211 -
 212
212 -
 213
213 -
 214
214 -
 215
215 -
 216
216
 |
 |

143
Financial statements
NOKIA IN 2015
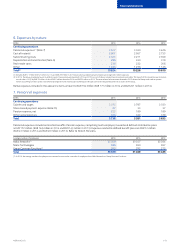
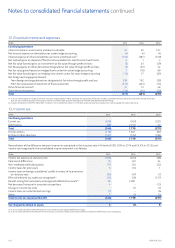
6. Expenses by nature
EURm 2015 2014 2013
Continuing operations
Personnel expenses(1) (Note 7) 3 617 3 340 3 426
Cost of material 2 907 2 957 2 755
Subcontracting costs 2 323 2 211 2 659
Depreciation and amortization (Note 9) 286 240 319
Real estate costs 236 232 306
Other 1 455 1 276 1 146
Total(2) 10 824 10 256 10 610
(1) Excludes EUR 121 million (EUR 41 million in 2014 and EUR 209 million in 2013) restructuring-related personnel expenses recognized in other expenses.
(2) In 2015, the Group recorded amounts in order to correct items previously reported in 2014 and 2013 as cost of sales and reductions to accounts receivable. The impact of this correction was to reduce
cost of sales in 2015 by EUR 37 million, of which EUR 7 million related to 2014 and EUR 30 million to 2013. The error related to businesses divested in 2013 where the Group continued to operate
certain accounting functions under a transitional arrangement and erroneously recorded pass-through costs of the disposed businesses as costs of the Group.
Rental expenses included in the above line items amount to EUR 164 million (EUR 171 million in 2014 and EUR 241 million in 2013).
7. Personnel expenses
EURm 2015 2014 2013
Continuing operations
Salaries and wages 3 075 2 797 3 030
Share-based payment expense (Note 25) 67 53 37
Pension expense, net 223 189 189
Other social expenses 373 342 379
Total 3 738 3 381 3 635
Personnel expenses include termination benets. Pension expense, comprising multi-employer, insured and dened contribution plans
isEUR172 million ( EUR 146 million in 2014 and EUR 143 million in 2013). Expenses related to dened benet plans are EUR 51 million
(EUR43million in 2014 and EUR 46 million in 2013). Refer to Note 8, Pensions.
Average number of employees 2015 2014 2013
Nokia Networks(1) 55 509 50 557 52 564
Nokia Technologies 596 650 657
Group Common Functions(1) 585 292 215
Total 56 690 51 499 53 436
(1) In 2014, the average number of employees was restated to account for a transfer of employees from Nokia Networks to Group Common Functions.
