Nokia 2015 Annual Report Download - page 112
Download and view the complete annual report
Please find page 112 of the 2015 Nokia annual report below. You can navigate through the pages in the report by either clicking on the pages listed below, or by using the keyword search tool below to find specific information within the annual report.-
 1
1 -
2
-
3
-
4
-
5
-
6
-
7
-
8
-
9
-
10
-
11
-
12
-
13
-
14
-
15
-
16
-
17
-
18
-
19
-
20
-
21
-
22
-
23
-
24
-
25
-
26
-
27
-
28
-
29
-
30
-
31
-
32
-
33
-
34
-
35
-
36
-
37
-
38
-
39
-
40
-
41
-
42
-
43
-
44
-
45
-
46
-
47
-
48
-
49
-
50
-
51
-
52
-
53
-
54
-
55
-
56
-
57
-
58
-
59
-
60
-
61
-
62
-
63
-
64
-
65
-
66
-
67
-
68
-
69
-
70
-
71
-
72
-
73
-
74
-
75
-
76
-
77
-
78
-
79
-
80
-
81
-
82
-
83
-
84
-
85
-
86
-
87
-
88
-
89
-
90
-
91
-
92
-
93
-
94
-
95
-
96
-
97
-
98
-
99
-
100
-
101
-
 102
102 -
 103
103 -
 104
104 -
 105
105 -
 106
106 -
 107
107 -
 108
108 -
 109
109 -
 110
110 -
 111
111 -
 112
112 -
 113
113 -
 114
114 -
 115
115 -
 116
116 -
 117
117 -
 118
118 -
 119
119 -
 120
120 -
 121
121 -
 122
122 -
123
-
124
-
125
-
126
-
127
-
128
-
129
-
130
-
131
-
132
-
133
-
134
-
135
-
136
-
137
-
138
-
139
-
140
-
141
-
142
-
143
-
144
-
145
-
146
-
147
-
148
-
149
-
150
-
151
-
152
-
153
-
154
-
155
-
156
-
157
-
158
-
159
-
160
-
161
-
162
-
163
-
164
-
165
-
166
-
167
-
168
-
169
-
170
-
171
-
172
-
173
-
174
-
175
-
176
-
177
-
178
-
179
-
180
-
181
-
182
-
183
-
184
-
185
-
186
-
187
-
188
-
189
-
190
-
191
-
192
-
193
-
194
-
195
-
196
-
197
-
198
-
199
-
200
-
201
-
202
-
203
-
204
-
205
-
206
-
207
-
208
-
209
-
210
-
211
-
212
-
213
-
214
-
215
-
216
 |
 |
110 NOKIA IN 2015
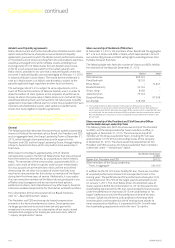
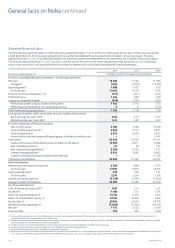
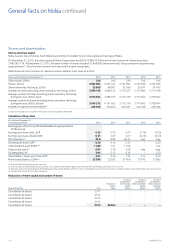
Shares and shareholders
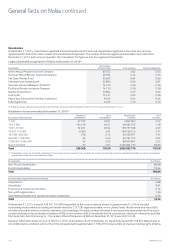
Shares and share capital
Nokia has one class of shares. Each Nokia share entitles the holder to one vote at general meetings of Nokia.
On December 31, 2015, the share capital of Nokia Corporation was EUR 245 896 461.96 and the total number of shares issued was
3992863716. At December 31, 2015, the total number of shares included 53 668 695 shares owned by Group companies representing
approximately 1.3% of the total number of shares and the total voting rights.
Nokia does not have minimum or maximum share capital or a par value of a share.
Share capital and shares at December 31 2015 2014 2013 2012 2011
Share capital, EURm 246 246 246 246 246
Shares, (000s) 3 992 864 3 745 044 3 744 994 3 744 956 3 744 956
Shares owned by the Group, (000s) 53 669 96 901 32 568 33 971 34 767
Number of shares excluding shares owned by the Group, (000s) 3 939 195 3 648 143 3 712 427 3 710 985 3 710 189
Average number of shares excluding shares owned by the Group
during the year, (000s), basic 3 670 934 3 698 723 3 712 079 3 710 845 3 709 947
Average number of shares excluding shares owned by the Group
during the year, (000s), diluted 3 949 312 4 131 602 3 712 079 3 710 845 3 709 947
Number of registered shareholders(1) 209 509 216 830 225 587 250 799 229 096
(1) Each account operator is included in the gure as only one registered shareholder.
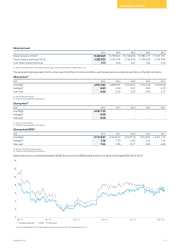
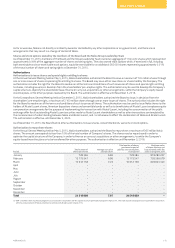
Calculation of key ratios
Key ratios at December 31,
Continuing operations 2015 2014 2013 2012 2011
Earnings per share for prot attributable to equity holders
of the parent
Earnings per share, basic, EUR 0.32 0.73 0.07 (0.16) (0.00)
Earnings per share, diluted, EUR 0.31 0.67 0.07 (0.16) (0.00)
P/E ratio, basic(1) 20.6 8.99 83.14 neg. neg.
Dividend per share, EUR(2) 0.26 0.14 0.37 –0.20
Total dividends paid, EURm(2)(3) 1 488 511 1 374 –742
Payout ratio, basic(2) 0.81 0.19 5.29 neg. neg.
Dividend yield, %(2) 3.94 2.13 6.36 –5.30
Shareholders’ equity per share, EUR(4) 2.67 2.36 1.74 2.14 3.20
Market capitalization, EURm(4) 25 999 23 932 21 606 10 873 13 987
(1) Based on Nokia closing share price at year-end.
(2) In 2015, based on Board of Directors proposal for 2015, subject to shareholders approval at the Annual General Meeting convening on June 16, 2016.
(3) Maximum amount to be distributed as dividends based on the number of shares at March 31, 2016, excluding the number of treasury shares. Comparative gures represent the total actual amounts paid.
(4) Excludes shares owned by the Group companies.
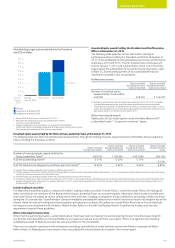
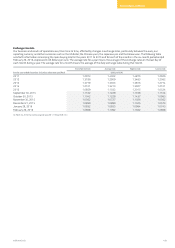
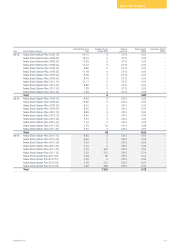
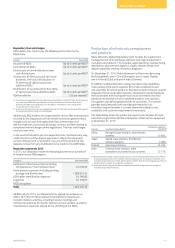
Reductions of share capital and number of shares
Type of reduction Year
Number of
shares
000s
Amount
of reduction
of the share
capital
EURm
Amount
of reduction
of the restricted
capital
EURm
Amount
of reduction
of the retained
earnings
EURm
Cancellation of shares 2011 – – – –
Cancellation of shares 2012 – – – –
Cancellation of shares 2013 – – – –
Cancellation of shares 2014 – – – –
Cancellation of shares 2015 66 904 – – –
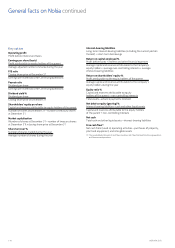
General facts on Nokia continued