Nokia 2015 Annual Report Download - page 51
Download and view the complete annual report
Please find page 51 of the 2015 Nokia annual report below. You can navigate through the pages in the report by either clicking on the pages listed below, or by using the keyword search tool below to find specific information within the annual report.
49
Board review
NOKIA IN 2015
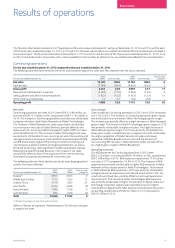
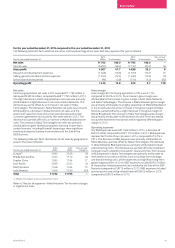
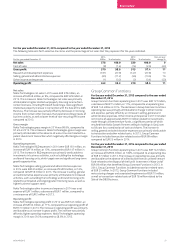
For the year ended December 31, 2014 compared to the year ended December 31, 2013
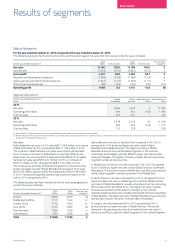
The following table sets forth selective line items and the percentage of net sales that they represent for years indicated.
For the year ended December 31
2014
EURm % of net sales
2013
EURm % of net sales
Year-on-year
change %
Net sales 11 762 100.0 11 795 100.0 –
Cost of sales (6 855) (58.3) (7 157) (60.7) (4)
Gross prot 4 907 41.7 4 638 39.3 6
Research and development expenses (1 948) (16.6) (1 970) (16.7) (1)
Selling, general and administrative expenses (1 453) (12.4) (1 483) (12.6) (2)
Other income and expenses (94) (0.8) (513) (4.3) (82)
Operating prot 1 412 12.0 672 5.7 110
Net sales
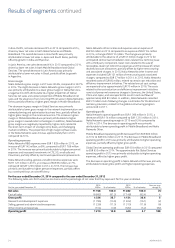
Continuing operations net sales in 2014 were EUR 11 762 million, a
decrease of EUR 33 million, compared to EUR 11 795 million in2013.
The slight decrease in Continuing operations net sales was primarily
attributable to a slight decrease in net sales in Nokia Networks. The
decrease was partly oset by an increase in net sales inNokia
Technologies. The decrease in Nokia Networks net sales was primarily
attributable to a decrease in Global Services net sales, and the
absence of sales from businesses that were divested and certain
customer agreements and countries that were exited in 2013. The
decrease was partially oset by an increase in Mobile Broadband net
sales. The increase in Nokia Technologies net sales was primarily
attributable to higher intellectual property licensing income from
certain licensees, including Microsoft becoming a more signicant
intellectual property licensee in connection with the Sale of the
D&SBusiness.
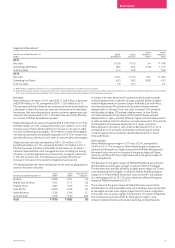
The following table sets forth distribution of net sales by geographical
area for the years indicated.
For the year ended December 31
2014
EURm
2013
EURm
Year-on-year
change %
Europe(1) 3 493 3 556 (2)
Middle East & Africa 1 053 1 112 (5)
Greater China 1 380 1 184 17
Asia-Pacic 3 289 3 353 (2)
North America 1 538 1 334 15
Latin America 1 009 1 256 (20)
Total 11 762 11 795 –
(1) All Nokia Technologies net sales are allocated to Finland.
Refer to “Results of segments—Nokia Networks” for the main changes
in regional net sales.
Gross margin
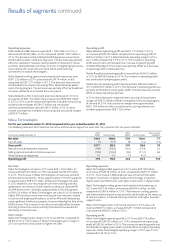
Gross margin for Continuing operations in 2014 was 41.7%,
comparedto 39.3% in 2013. The increase in gross margin was
attributable to the increase in gross margin in both Nokia Networks
and Nokia Technologies. The increase in Nokia Networks gross margin
was primarily attributable to a higher proportion of Mobile Broadband
in the overall sales mix and an increase in the gross margin of Global
Services, partially oset by a slight decrease in the gross margin of
Mobile Broadband. The increase in Nokia Technologies gross margin
was primarily attributable to the absence of a one-time cost related
toa patent divestment transaction which negatively aected gross
margin in2013.
Operating expenses
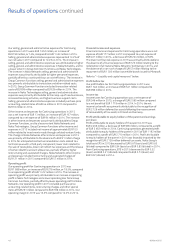
Our R&D expenses were EUR 1 948 million in 2014, a decrease of
EUR22 million compared to EUR 1 970 million in 2013. R&D expenses
represented 16.6% of our net sales in 2014, compared to 16.7% in
2013. The decrease in R&D expenses was primarily attributable to
Nokia Networks, partially oset by Nokia Technologies. The decrease
inNokia Networks R&D expenses was primarily attributable to lower
subcontracting costs. The decrease was partially oset by headcount
increases mainly related to increased in-house activities. The increase
in R&D expenses in Nokia Technologies was primarily attributable to
investments in business activities, such as building the technology
andbrand licensing units, which target new and signicant long-term
growth opportunities. In 2014, R&D expenses included EUR 13 million
of transaction-related personnel costs related to the Sale of the D&S
Business compared to EUR 15 million in 2013. R&D expenses included
purchase price accounting-related items of EUR 32 million in 2014,
compared to EUR 20 million in 2013.


