Nokia 2015 Annual Report Download - page 122
Download and view the complete annual report
Please find page 122 of the 2015 Nokia annual report below. You can navigate through the pages in the report by either clicking on the pages listed below, or by using the keyword search tool below to find specific information within the annual report.-
 1
1 -
2
-
3
-
4
-
5
-
6
-
7
-
8
-
9
-
10
-
11
-
12
-
13
-
14
-
15
-
16
-
17
-
18
-
19
-
20
-
21
-
22
-
23
-
24
-
25
-
26
-
27
-
28
-
29
-
30
-
31
-
32
-
33
-
34
-
35
-
36
-
37
-
38
-
39
-
40
-
41
-
42
-
43
-
44
-
45
-
46
-
47
-
48
-
49
-
50
-
51
-
52
-
53
-
54
-
55
-
56
-
57
-
58
-
59
-
60
-
61
-
62
-
63
-
64
-
65
-
66
-
67
-
68
-
69
-
70
-
71
-
72
-
73
-
74
-
75
-
76
-
77
-
78
-
79
-
80
-
81
-
82
-
83
-
84
-
85
-
86
-
87
-
88
-
89
-
90
-
91
-
92
-
93
-
94
-
95
-
96
-
97
-
98
-
99
-
100
-
101
-
102
-
103
-
104
-
105
-
106
-
107
-
108
-
109
-
110
-
111
-
 112
112 -
 113
113 -
 114
114 -
 115
115 -
 116
116 -
 117
117 -
 118
118 -
 119
119 -
 120
120 -
 121
121 -
 122
122 -
 123
123 -
 124
124 -
 125
125 -
 126
126 -
 127
127 -
 128
128 -
 129
129 -
 130
130 -
 131
131 -
 132
132 -
133
-
134
-
135
-
136
-
137
-
138
-
139
-
140
-
141
-
142
-
143
-
144
-
145
-
146
-
147
-
148
-
149
-
150
-
151
-
152
-
153
-
154
-
155
-
156
-
157
-
158
-
159
-
160
-
161
-
162
-
163
-
164
-
165
-
166
-
167
-
168
-
169
-
170
-
171
-
172
-
173
-
174
-
175
-
176
-
177
-
178
-
179
-
180
-
181
-
182
-
183
-
184
-
185
-
186
-
187
-
188
-
189
-
190
-
191
-
192
-
193
-
194
-
195
-
196
-
197
-
198
-
199
-
200
-
201
-
202
-
203
-
204
-
205
-
206
-
207
-
208
-
209
-
210
-
211
-
212
-
213
-
214
-
215
-
216
 |
 |

120 NOKIA IN 2015
For the year ended December 31 Notes
2015
EURm
2014
EURm
2013
EURm
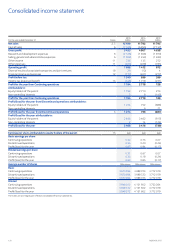
Net sales 2, 5 12 499 11 762 11 795
Cost of sales 6 (7 046) (6 855) (7 157)
Gross prot 5 453 4 907 4 638
Research and development expenses 6 (2 126) (1 948) (1 970)
Selling, general and administrative expenses 6 (1 652) (1 453) (1 483)
Other income 11 236 135 272
Other expenses 11 (223) (229) (785)
Operating prot 1 688 1 412 672
Share of results of associated companies and joint ventures 18 29 (12) 4
Financial income and expenses 12 (177) (401) (277)
Prot before tax 1 540 999 399
Income tax (expense)/benet 13 (346) 1 719 (271)
Prot for the year from Continuing operations 1 194 2 718 128
Attributable to:
Equity holders of the parent 1 192 2 710 273
Non-controlling interests 2 8 (145)
Prot for the year from Continuing operations 1 194 2 718 128
Prot/(loss) for the year from Discontinued operations attributable to:
Equity holders of the parent 1 274 752 (888)
Non-controlling interests – 6 21
Prot/(loss) for the year from Discontinued operations 3 1 274 758 (867)
Prot/(loss) for the year attributable to:
Equity holders of the parent 2 466 3 462 (615)
Non-controlling interests 2 14 (124)
Prot/(loss) for the year 2 468 3 476 (739)
Earnings per share attributable to equity holders of the parent 15 EUR EUR EUR
Basic earnings per share
Continuing operations 0.32 0.73 0.07
Discontinued operations 0.35 0.20 (0.24)
Prot/(loss) for the year 0.67 0.94 (0.17)
Diluted earnings per share
Continuing operations 0.31 0.67 0.07
Discontinued operations 0.32 0.18 (0.24)
Prot/(loss) for the year 0.63 0.85 (0.17)
Average number of shares 000s shares 000s shares 000s shares
Basic
Continuing operations 3 670 934 3 698 723 3 712 079
Discontinued operations 3 670 934 3 698 723 3 712 079
Prot/(loss) for the year 3 670 934 3 698 723 3 712 079
Diluted
Continuing operations 3 949 312 4 131 602 3 733 364
Discontinued operations 3 949 312 4 131 602 3 712 079
Prot/(loss) for the year 3 949 312 4 131 602 3 712 079
The notes are an integral part of these consolidated nancial statements.
Consolidated income statement