Nokia 2015 Annual Report Download - page 147
Download and view the complete annual report
Please find page 147 of the 2015 Nokia annual report below. You can navigate through the pages in the report by either clicking on the pages listed below, or by using the keyword search tool below to find specific information within the annual report.-
 1
1 -
2
-
3
-
4
-
5
-
6
-
7
-
8
-
9
-
10
-
11
-
12
-
13
-
14
-
15
-
16
-
17
-
18
-
19
-
20
-
21
-
22
-
23
-
24
-
25
-
26
-
27
-
28
-
29
-
30
-
31
-
32
-
33
-
34
-
35
-
36
-
37
-
38
-
39
-
40
-
41
-
42
-
43
-
44
-
45
-
46
-
47
-
48
-
49
-
50
-
51
-
52
-
53
-
54
-
55
-
56
-
57
-
58
-
59
-
60
-
61
-
62
-
63
-
64
-
65
-
66
-
67
-
68
-
69
-
70
-
71
-
72
-
73
-
74
-
75
-
76
-
77
-
78
-
79
-
80
-
81
-
82
-
83
-
84
-
85
-
86
-
87
-
88
-
89
-
90
-
91
-
92
-
93
-
94
-
95
-
96
-
97
-
98
-
99
-
100
-
101
-
102
-
103
-
104
-
105
-
106
-
107
-
108
-
109
-
110
-
111
-
112
-
113
-
114
-
115
-
116
-
117
-
118
-
119
-
120
-
121
-
122
-
123
-
124
-
125
-
126
-
127
-
128
-
129
-
130
-
131
-
132
-
133
-
134
-
135
-
136
-
 137
137 -
 138
138 -
 139
139 -
 140
140 -
 141
141 -
 142
142 -
 143
143 -
 144
144 -
 145
145 -
 146
146 -
 147
147 -
 148
148 -
 149
149 -
 150
150 -
 151
151 -
 152
152 -
 153
153 -
 154
154 -
 155
155 -
 156
156 -
 157
157 -
158
-
159
-
160
-
161
-
162
-
163
-
164
-
165
-
166
-
167
-
168
-
169
-
170
-
171
-
172
-
173
-
174
-
175
-
176
-
177
-
178
-
179
-
180
-
181
-
182
-
183
-
184
-
185
-
186
-
187
-
188
-
189
-
190
-
191
-
192
-
193
-
194
-
195
-
196
-
197
-
198
-
199
-
200
-
201
-
202
-
203
-
204
-
205
-
206
-
207
-
208
-
209
-
210
-
211
-
212
-
213
-
214
-
215
-
216
 |
 |

145
Financial statements
NOKIA IN 2015
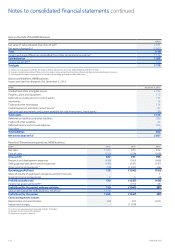
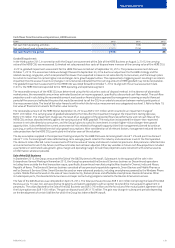
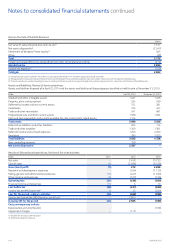
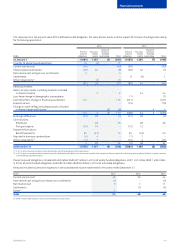
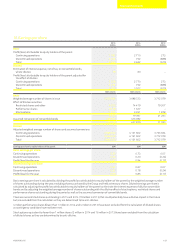
The movements in the present value of the dened benet obligation, fair value of plan assets and the impact of minimum funding/asset ceiling
for Continuing operations:
EURm
2015 2014
Present
value of
obligation
Fair value
of plan
assets
Impact of
minimum
funding/
asset ceiling Total
Present
value of
obligation
Fair value
of plan
assets
Impact of
minimum
funding/
asset ceiling Total
At January 1 (1 884) 1 387 (3) (500) (1 453) 1 261 (7) (199)
Transfer to Discontinued operations 16 (5) 11 –
Current service cost (46) (46) (39) (39)
Interest (expense)/income (49) 40 (9) (59) 52 (7)
Past service cost and gains on curtailments 5 5 –
Settlements – 9 (8) 1
Other movements(1) (1) (1)
–
(90) 39 – (51) (89) 44 – (45)
Remeasurements:
Return on plan assets, excluding amounts included
ininterest income 2 2 44 44
Loss from change in demographic assumptions – (1) (1)
Gain/(loss) from change in nancial assumptions 114 114 (321) (321)
Experience loss – (16) (16)
Change in asset ceiling, excluding amounts included
ininterest (expense)/income (6) (6) 4 4
114 2 (6) 110 (338) 44 4 (290)
Exchange dierences (35) 28 (7) (31) 28 (3)
Contributions:
Employers 26 26 28 28
Plan participants (16) 16 – (12) 12 –
Payments from plans:
Benet payments 60 (47) 13 55 (35) 20
Acquired in business combinations (4) 4 – (1) 1 –
Other movements(2) (1) 1 – (15) 4 (11)
4 28 – 32 (4) 38 – 34
At December 31 (1 840) 1 451 (9) (398) (1 884) 1 387 (3) (500)
(1) In 2015, other movements relate to the administration costs that are deducted from plan assets.
(2) In 2014, other movements relate to the inclusion of the dened benet liability of end of service benets that have previously been reported as other long-term employee liabilities in certain countries
in the Middle East and Africa region.
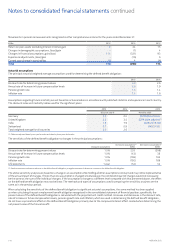
Present value of obligations include EUR 428 million (EUR 407 million in 2014) of wholly funded obligations, EUR 1 337 million (EUR 1 408 million
in 2014) of partly funded obligations and EUR 75 million (EUR 69 million in 2014) of unfunded obligations.
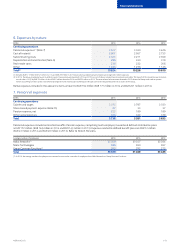
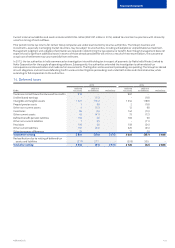
Amounts included in personnel expenses in the consolidated income statement for the years ended December 31:
EURm 2015 2014 2013
Current service cost 46 39 44
Past service cost and gains and losses on curtailments (5) –(5)
Net interest cost 9711
Settlements –(1) (4)
Other(1) 1– –
Total 51 45 46
(1) Other includes administration costs that are deducted from plan assets.