Nokia 2015 Annual Report Download - page 119
Download and view the complete annual report
Please find page 119 of the 2015 Nokia annual report below. You can navigate through the pages in the report by either clicking on the pages listed below, or by using the keyword search tool below to find specific information within the annual report.-
 1
1 -
2
-
3
-
4
-
5
-
6
-
7
-
8
-
9
-
10
-
11
-
12
-
13
-
14
-
15
-
16
-
17
-
18
-
19
-
20
-
21
-
22
-
23
-
24
-
25
-
26
-
27
-
28
-
29
-
30
-
31
-
32
-
33
-
34
-
35
-
36
-
37
-
38
-
39
-
40
-
41
-
42
-
43
-
44
-
45
-
46
-
47
-
48
-
49
-
50
-
51
-
52
-
53
-
54
-
55
-
56
-
57
-
58
-
59
-
60
-
61
-
62
-
63
-
64
-
65
-
66
-
67
-
68
-
69
-
70
-
71
-
72
-
73
-
74
-
75
-
76
-
77
-
78
-
79
-
80
-
81
-
82
-
83
-
84
-
85
-
86
-
87
-
88
-
89
-
90
-
91
-
92
-
93
-
94
-
95
-
96
-
97
-
98
-
99
-
100
-
101
-
102
-
103
-
104
-
105
-
106
-
107
-
108
-
 109
109 -
 110
110 -
 111
111 -
 112
112 -
 113
113 -
 114
114 -
 115
115 -
 116
116 -
 117
117 -
 118
118 -
 119
119 -
 120
120 -
 121
121 -
 122
122 -
 123
123 -
 124
124 -
 125
125 -
 126
126 -
 127
127 -
 128
128 -
 129
129 -
130
-
131
-
132
-
133
-
134
-
135
-
136
-
137
-
138
-
139
-
140
-
141
-
142
-
143
-
144
-
145
-
146
-
147
-
148
-
149
-
150
-
151
-
152
-
153
-
154
-
155
-
156
-
157
-
158
-
159
-
160
-
161
-
162
-
163
-
164
-
165
-
166
-
167
-
168
-
169
-
170
-
171
-
172
-
173
-
174
-
175
-
176
-
177
-
178
-
179
-
180
-
181
-
182
-
183
-
184
-
185
-
186
-
187
-
188
-
189
-
190
-
191
-
192
-
193
-
194
-
195
-
196
-
197
-
198
-
199
-
200
-
201
-
202
-
203
-
204
-
205
-
206
-
207
-
208
-
209
-
210
-
211
-
212
-
213
-
214
-
215
-
216
 |
 |

117
General facts on Nokia
NOKIA IN 2015
Depositary fees and charges
ADS holders may have to pay the following service fees to the
Depositary:
Service Fees (USD)
Issuance of ADSs Up to 5 cents per ADS(1)
Cancellation of ADSs Up to 5 cents per ADS(1)
Distribution of cash dividends or other
cash distributions Up to 2 cents per ADS(2)
Distribution of ADSs pursuant to (i) stock
dividends, free stock distributions or
(ii)exercises of rights to purchase
additional ADSs Up to 5 cents per ADS(2)
Distribution of securities other than ADSs
or rights to purchase additional ADSs Up to 5 cents per ADS(1)
ADR transfer fee 1.50 per transfer(1)
(1) These fees are typically paid to the Depositary by the brokers on behalf of their clients receiving
the newly issued ADSs from the Depositary and by the brokers on behalf of their clients
delivering the ADSs to the Depositary for cancellation. The brokers in turn charge these
transaction fees to their clients.
(2) In practice, the Depositary has not collected these fees. If collected, such fees are oset against
the related distribution made to the ADR holder.
Additionally, ADS holders are responsible for certain fees and expenses
incurred by the Depositary on their behalf and certain governmental
charges such as taxes and registration fees, transmission and
deliveryexpenses, conversion of foreign currency and fees relating to
compliance with exchange control regulations. The fees and charges
may vary over time.
In the event of refusal to pay the depositary fees, the Depositary may,
under the terms of the deposit agreement, refuse the requested
service until payment is received or may set-o the amount of the
depositary fees from any distribution to be made to the ADR holder.
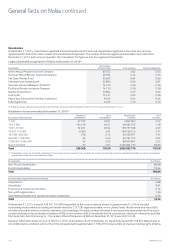
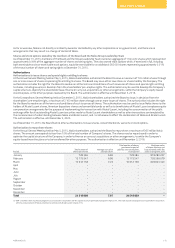
Depositary payments 2015
In 2015, our Depositary made the following payments on our behalf
inrelation to our ADR program.
Category Payment (USD)
Settlement infrastructure fees (including
theDepositary Trust Company fees) 45 006.55
Proxy process expenses (including printing,
postage and distribution) 1 288 957.34
ADS holder identication expenses 63 790.83
Legal fees 50 709.07
NYSE listing fees –
Total 1 448 463.79
Additionally for 2015, our Depositary has agreed to reimburse us
USD4 567 796.00 mainly related to contributions towards our
investor relations activities, including investor meetings and
conferences and fees of investor relations service vendors, and other
miscellaneous expenses related to the US listing of our ADSs.
Production of infrastructure equipment
andproducts
Nokia Networks’ Global Operations team handles the supply chain
management of all its hardware, software and original equipment
manufacturer products. This includes supply planning, manufacturing,
distribution, procurement, logistics, supply, network design and
delivery capability creation in product programs.
On December 31, 2015, Nokia Networks had four manufacturing
facilities globally: one in China (Shanghai), one in Japan (Saedo),
oneinFinland (Oulu), and one in India (Chennai).
In addition to Nokia Networks’ strong manufacturing capabilities,
italso utilizes third-party suppliers for certain components and
sub-assembly for certain products. Examples include company-specic
integrated circuits and radio frequency components. Nokia Networks
then assembles these components and sub-assemblies into nal
products and solutions and, for selected products and solutions,
itssuppliers also deliver goods directly to customers. This system
provides Nokia Networks with considerable exibility in its
manufacturing and enables it to meet demands related to cost,
availability and customer requirements more easily.
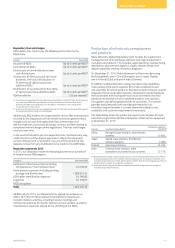
The table below shows the productive capacity per location of major
manufacturing facilities for Nokia Networks’ infrastructure equipment
at December 31, 2015.
Country Location and products(1)
Productive capacity,
Net (m2)(2)
China Shanghai: base stations, transmission
systems 15 954
Japan Saedo: base stations, distributed
antenna systems 2 698
Finland Oulu: base stations 14 784
India Chennai: base stations, radio
controllers and transmission systems 12 778
(1) Nokia Networks considers the production capacity of its manufacturing facilities to be sucient
to meet the requirements of its network infrastructure business. The extent of utilization of its
manufacturing facilities varies from plant to plant and from time to time during the year. None of
these facilities is subject to a material encumbrance.
(2) Productive capacity equals the total area allotted to manufacturing and to the storage of
manufacturing-related materials.