Nokia 2015 Annual Report Download - page 125
Download and view the complete annual report
Please find page 125 of the 2015 Nokia annual report below. You can navigate through the pages in the report by either clicking on the pages listed below, or by using the keyword search tool below to find specific information within the annual report.-
 1
1 -
2
-
3
-
4
-
5
-
6
-
7
-
8
-
9
-
10
-
11
-
12
-
13
-
14
-
15
-
16
-
17
-
18
-
19
-
20
-
21
-
22
-
23
-
24
-
25
-
26
-
27
-
28
-
29
-
30
-
31
-
32
-
33
-
34
-
35
-
36
-
37
-
38
-
39
-
40
-
41
-
42
-
43
-
44
-
45
-
46
-
47
-
48
-
49
-
50
-
51
-
52
-
53
-
54
-
55
-
56
-
57
-
58
-
59
-
60
-
61
-
62
-
63
-
64
-
65
-
66
-
67
-
68
-
69
-
70
-
71
-
72
-
73
-
74
-
75
-
76
-
77
-
78
-
79
-
80
-
81
-
82
-
83
-
84
-
85
-
86
-
87
-
88
-
89
-
90
-
91
-
92
-
93
-
94
-
95
-
96
-
97
-
98
-
99
-
100
-
101
-
102
-
103
-
104
-
105
-
106
-
107
-
108
-
109
-
110
-
111
-
112
-
113
-
114
-
 115
115 -
 116
116 -
 117
117 -
 118
118 -
 119
119 -
 120
120 -
 121
121 -
 122
122 -
 123
123 -
 124
124 -
 125
125 -
 126
126 -
 127
127 -
 128
128 -
 129
129 -
 130
130 -
 131
131 -
 132
132 -
 133
133 -
 134
134 -
 135
135 -
136
-
137
-
138
-
139
-
140
-
141
-
142
-
143
-
144
-
145
-
146
-
147
-
148
-
149
-
150
-
151
-
152
-
153
-
154
-
155
-
156
-
157
-
158
-
159
-
160
-
161
-
162
-
163
-
164
-
165
-
166
-
167
-
168
-
169
-
170
-
171
-
172
-
173
-
174
-
175
-
176
-
177
-
178
-
179
-
180
-
181
-
182
-
183
-
184
-
185
-
186
-
187
-
188
-
189
-
190
-
191
-
192
-
193
-
194
-
195
-
196
-
197
-
198
-
199
-
200
-
201
-
202
-
203
-
204
-
205
-
206
-
207
-
208
-
209
-
210
-
211
-
212
-
213
-
214
-
215
-
216
 |
 |

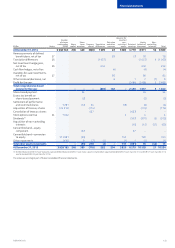
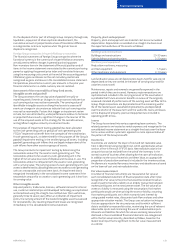
123
Financial statements
NOKIA IN 2015
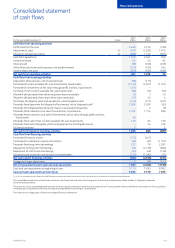
For the year ended December 31 Notes
2015
EURm
2014
EURm
2013
EURm
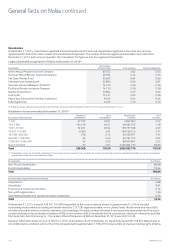
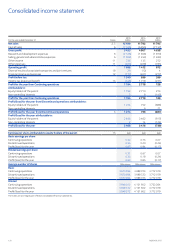
Cash ow from operating activities
Prot/(loss) for the year 2 468 3 476 (739)
Adjustments, total 32 (261) (2 262) 1 913
Change in net working capital 32 (998) 1 153 (945)
Cash from operations 1 209 2 367 229
Interest received 62 45 92
Interest paid (99) (336) (208)
Other nancial income and expenses, net (paid)/received (375) (165) 345
Income taxes, net paid (290) (636) (386)
Net cash from operating activities 507 1 275 72
Cash ow from investing activities
Acquisition of businesses, net of acquired cash (98) (175) –
Purchase of current available-for-sale investments, liquid assets (3 133) (2 977) (1 021)
Purchase of investments at fair value through prot and loss, liquid assets (311) – –
Purchase of non-current available-for-sale investments (88) (73) (53)
(Payment of)/proceeds from other long-term loans receivable (2) 7 (1)
(Payment of)/proceeds from short-term loans receivable (17) 20 4
Purchases of property, plant and equipment, and intangible assets (314) (311) (407)
Proceeds from/(payment for) disposal of businesses, net of disposed cash(1) 2 586 2 508 (63)
Proceeds from disposal/(purchase) of shares in associated companies –7 (8)
Proceeds from maturities and sale of investments, liquid assets 3 074 1 774 586
Proceeds from maturities and sale of investments at fair value through prot and loss,
liquid assets 48 – –
Proceeds from sale of non-current available-for-sale investments 149 62 129
Proceeds from sale of property, plant and equipment and intangible assets –44 138
Dividends received 2 – 5
Net cash from/(used in) investing activities 1 896 886 (691)
Cash ow from nancing activities
Purchase of treasury shares (173) (427) –
Purchase of a subsidiary’s equity instruments (52) (45) (1 707)
Proceeds from long-term borrowings 232 79 2 291
Repayment of long-term borrowings (24) (2 749) (862)
Repayment of short-term borrowings (55) (42) (128)
Dividends paid and other contributions to shareholders (512) (1 392) (71)
Net cash used in nancing activities (584) (4 576) (477)
Foreign exchange adjustment 6 (48) (223)
Net increase/(decrease) in cash and cash equivalents 1 825 (2 463) (1 319)
Cash and cash equivalents at beginning of year 5 170 7 633 8 952
Cash and cash equivalents at end of year 6 995 5 170 7 633
(1) In 2014, proceeds from the Sale of the D&S Business are presented net of the amount of principal and accrued interest on the repaid convertible bonds.
The consolidated statement of cash ows combines cash ows from both the Continuing and the Discontinued operations. Refer to Note 3, Disposals treated as
Discontinued operations.
The amounts in the consolidated statement of cash ows cannot be directly traced from the statement of nancial position without additional information on the acquisitions
and disposals of subsidiaries and the net foreign exchange dierences arising on consolidation.
The notes are an integral part of these consolidated nancial statements.
Consolidated statement
of cash ows